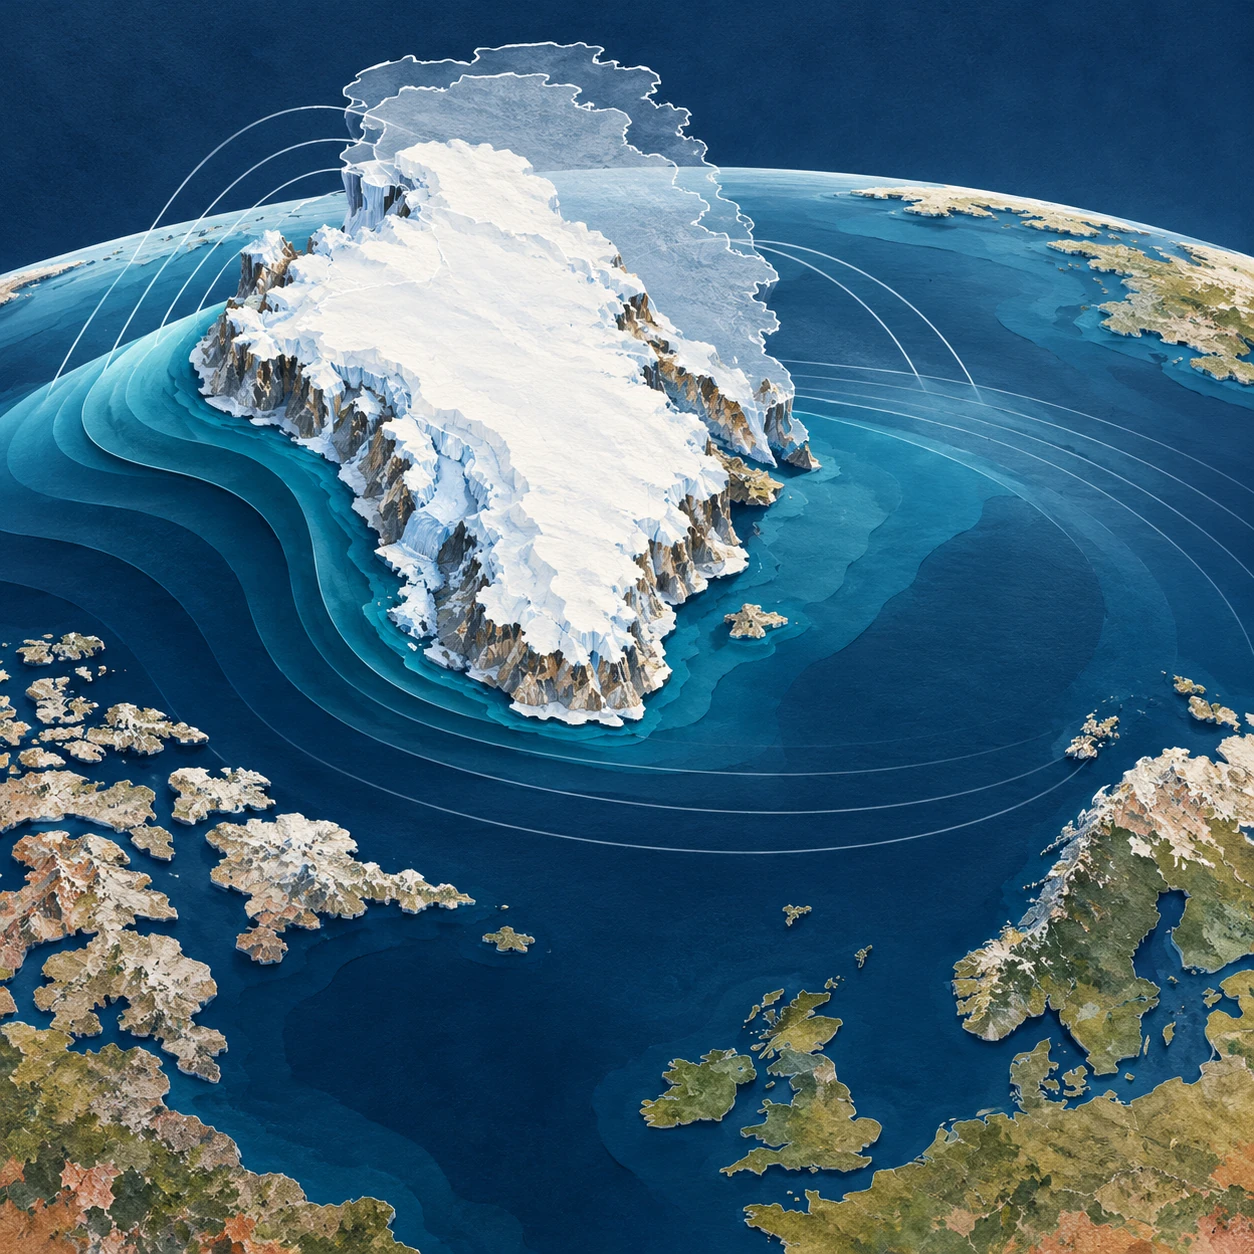
Melting land ice adds water to the ocean. It seems obvious that the sea should rise everywhere. Yet close to a large ice sheet, one contribution to sea-level change can go in the opposite direction: the nearby sea can fall as the ice loses mass.
The apparent contradiction comes from imagining the ocean as a bathtub with a fixed bottom and a level surface independent of gravity. Earth has neither of those conveniences. Its sea surface, solid ground, and rotation all respond when a very large mass is moved.
An ice sheet attracts water
Greenland and Antarctica are not merely containers of frozen water. Their mass contributes to Earth’s gravitational field and attracts nearby ocean water. Remove some ice and that attraction weakens. Water redistributes away from the shrinking ice sheet, while the added meltwater is spread through the ocean in a geographically uneven way.
NASA JPL’s explanation of sea-level fingerprints describes why a source’s location and size create a characteristic response. A kilogram lost from one ice region does not have precisely the same local sea-level effect as a kilogram lost from another. The ocean retains information about where the mass came from.
“Attraction” here is not a second ocean sitting above the ordinary ocean. It is a small contribution to the shape of an already complex gravity-defined sea surface. The complete gravity field remains dominated by Earth as a whole.
The land is not a fixed ruler
Removing a load also allows solid Earth to deform, with both relatively rapid elastic responses and longer-lived adjustment to past ice changes. A coastline can move vertically while the ocean surface moves too. Relative sea level measures the water against the land at that location; satellite altimetry describes sea-surface height in a different reference system.
NASA’s sea-level FAQ places ice-mass redistribution alongside other reasons sea level differs geographically. Ocean circulation, heat, land-water storage, and local land motion further complicate the total observed change.
This is why a fingerprint is usually a statement about a particular contribution. A negative contribution from nearby ice loss does not guarantee that the total measured sea level at a particular harbor will be falling. Other terms can outweigh it.
Keep the accounting visible
| Question | Useful quantity |
|---|---|
| What happens to the global water budget? | Global mean contribution from land-ice mass loss |
| How is that contribution distributed? | The source-specific sea-level fingerprint |
| What happens to this shoreline? | Total relative sea level, including land motion and other ocean effects |
Confusing these questions makes good science sound contradictory. A global average can rise while a component falls locally. A tide gauge can show a different trend from the neighboring sea surface if the ground carrying the gauge is moving.
A thought experiment with two islands
Imagine two coastal communities, one near a large ice sheet and one far away. Transfer the same amount of ice mass into the ocean in two hypothetical worlds: first from the nearby sheet, then from a distant sheet. Keep other factors fixed for the exercise.
The global mean added-water contribution could be the same in both worlds, while the local outcomes differ. In the first world, the nearby community experiences reduced attraction and a local solid-Earth response associated with its neighboring sheet. In the second, it occupies a different part of the distant source’s fingerprint.
No numerical forecast follows from this sketch. To calculate the difference, scientists need the geography of ice loss and a model that includes the relevant gravitational, rotational, and deformational response. The thought experiment simply shows why knowing the total melt is insufficient for knowing every coast’s change.
In your two-island sketch, use separate arrows for added water, changed attraction, and moving land. Do not draw one combined arrow until each contribution has a sign. This simple bookkeeping prevents the counterintuitive local response from obscuring the global mass balance that remains true at the same time.
How do scientists test the pattern?
One route combines gravity observations, estimates of land-water and ice-mass changes, and ocean measurements. NASA’s 2017 report of detected fingerprints describes evidence in ocean observations for predicted geographical patterns associated with changing continental water storage and ice mass.
Detecting the pattern is difficult because it sits within ocean variability rather than appearing as a neat ring on the sea. A model fingerprint is a structured prediction to test against data, not a colored map that becomes true merely because it was calculated.
A NASA modeling account shows how ice dynamics and sea-level response can be linked. Such coupled work is especially useful when the spatial pattern of mass loss changes over time instead of remaining one fixed source.
Read a fingerprint map carefully
Before interpreting its colors, find the normalization. Some maps show actual projected changes under a scenario; others show a response per unit of global mean sea-level contribution. A value on the second kind of map is a multiplier, not automatically a number of centimeters.
Then check whether the map includes only one source of ice loss, whether it is relative to land, and what time span or Earth model it assumes. A striking blue region near Greenland may mean a negative contribution from Greenland’s own loss. It does not erase storm surge, waves, subsidence, or the contributions of other ice sheets.
JPL’s work linking port-city sea level to regional ice melt illustrates why the source geography matters for place-specific assessment. The point is a more complete accounting of risk, not a promise that a nearby ice sheet protects every northern coast.
The useful surprise is that “level” is a physical condition rather than a universal height. Move enough mass and the meaning of the ocean’s resting surface changes. Once that is understood, the local fall beside melting ice stops being a paradox and becomes a measurable part of the larger rise.
Sources and a next step
- NASA JPL: sea-level fingerprints
- NASA: why sea level is not a bathtub
- NASA/UCI: observational fingerprint evidence
- NASA: linking glacier and sea-level models
- NASA JPL: port cities and regional ice loss
Continue exploring art, ideas, and unexpected connections at Incoprea.