Showing posts with label Perception. Show all posts

Thursday, October 22, 2026

A Color That Matches Here Can Split Apart Under Another Light

Two blue fabric samples are shown in a conceptual study of warm and cool illumination.
Lighting study. Display colors are illustrative; this image is not a calibrated metameric pair.

Two pieces of cloth match in the shop and disagree beside the window. One looks bluer; the other suddenly carries a hint of green. Nothing necessarily happened to either dye during the walk outside. What changed was the light illuminating them, and the match turned out to depend on that light.

The National Institute of Standards and Technology defines metamerism as perceived matching despite different spectral profiles. It is a compact definition with an expansive consequence: a color match need not be a match in the physical mixture of wavelengths reaching the eye.

“The same blue” can be two different recipes

Light arriving from an ordinary nonfluorescent surface depends on both the illumination spectrum and the surface's reflectance. A simple conceptual model multiplies the light available at each wavelength by the fraction the surface reflects there. Vision then combines this information through a small number of broad receptor responses. Different spectra can produce matching responses under a specified condition.

Change the illumination and the products change. Two reflectance curves that matched under one spectrum may no longer produce the same visual response. The match was real as a perceptual experience, but conditional as a relationship among object, light and observer. “It looked identical” and “the materials have identical spectral reflectance” are different statements.

For a toy analogy, imagine two three-bin reflectors: A returns fractions 0.2, 0.6 and 0.2; B returns 0.4, 0.2 and 0.4. Under equal illumination, a crude detector that merely totals the bins gives one unit for each. Under illumination weighted 1, 2, 1, A gives 1.6 and B gives 1.2. This is not a color-vision model. It demonstrates how different hidden recipes can agree under one input and diverge under another.

The zipper manufacturer has to care

This is not only an artist's puzzle. YKK's usage manual discusses mismatches among zipper tape, elements, sliders and garment fabric under different lighting. Different materials and colorants complicate a product that must look coherent. The manual specifies a reference lighting condition for its standard color matching rather than treating the room's nearest lamp as a neutral judge.

That is a practical lesson for any project involving more than one material. A printed cover, fabric binding and painted edge can agree in one studio and diverge in a customer's environment. The useful question is not whether one observer was wrong. It is which conditions the approval was intended to cover.

A reference illuminant is a defined condition

X-Rite's illuminant guide distinguishes standardized spectral descriptions used for color evaluation. A label such as D65 names a reference, not a promise that any lamp marketed as “daylight” reproduces the same spectrum. A repeatable evaluation needs more than a casual description of how warm or cool a room feels.

The company's color guide places metamerism within a broader measurement workflow. Instruments can record spectral properties that a three-number color description under one illuminant does not preserve. That is why a match report needs its measurement and viewing conditions if someone else is expected to reproduce it.

There are other reasons a pair of samples may look different: gloss, texture, viewing angle, fluorescence, surrounding colors and differences among observers. Calling every mismatch “metamerism” turns a useful term into a vague diagnosis. First identify what changed and what stayed comparable.

Why this cannot be proved by two colored squares on your screen

A screen can show a schematic “before” and “after,” but it cannot make its pixels acquire the spectral reflectance of two real fabrics. The monitor emits its own combination of primaries. Turning a room lamp on changes the physical samples' illumination much more directly than it changes the spectrum the screen emits.

The artwork here is therefore an invitation to inspect real materials, not a calibrated metameric demonstration. That distinction is part of understanding the phenomenon. A convincing picture can explain what to look for without reproducing the physical condition itself.

Color is often discussed as a possession: the cloth has a color, the paint has a color, the brand owns a color. Metamerism makes the relationship visible. A match is something materials, illumination and a visual system achieve together. Once you start recording those partners, the troublesome blue in the window becomes a question you can investigate rather than a contradiction you have to ignore.

Sources and a closer look: NIST: metamerism definition; YKK: lighting and garment color matching; X-Rite: reference illuminants; X-Rite: color guide and glossary.

Explore art, experiments and other unexpected connections at Incoprea.

Your Brain Can Hear a Bass Note That Is Missing

A loudspeaker can leave out a low frequency and still make a note seem to have that low pitch. This is not a secret subwoofer hiding in the room. A complex tone can carry a pattern of higher components from which the auditory system derives a pitch associated with an absent fundamental.

The surprise comes from treating pitch as though it were a label attached to one frequency in a recording. A recording contains physical pressure variations. Pitch is a percept. The two are closely related, but the missing-fundamental effect shows why they cannot simply be substituted for each other.

A conceptual piano illustration uses an empty low-key space as a metaphor for an absent fundamental.
Musical metaphor, not a piano construction diagram. The audio examples are original deterministic synthesis, not generated recordings.

Start with three sounds

The short original signals below let you compare a reference with two harmonic complexes. Set a comfortable low listening level. There is no need to turn the volume up to search for a hidden bass sound. Depending on hearing, equipment and attention, you may hear the relationship more or less strongly.

1. A 200 Hz reference

A single synthesized sinusoid, 2.5 seconds. It establishes a reference pitch; it is not a musical instrument recording.

2. A harmonic complex including 200 Hz

Synthesized components at 200, 400, 600, 800, 1000, 1200, 1400 and 1600 Hz, with decreasing amplitudes.

3. The complex with the 200 Hz component omitted

The synthesis includes components from 400 through 1600 Hz at 200 Hz spacing. No 200 Hz sinusoid was included. All examples have brief fades and comparable digital RMS levels.

Listen first for whether the third sound seems to belong near the same musical pitch as the first, rather than asking whether they have the same quality. They do not: their timbres differ substantially. A shared pitch can coexist with a changed brightness or roughness. If you focus on a high component, the experience may differ again.

A pattern can survive a missing member

The University of New South Wales music-acoustics guide distinguishes a fundamental from the harmonics of a periodic sound. In the example here, higher components remain integer multiples of 200 Hz even when the component at 200 is removed. Their relationship still identifies a common repetition rate.

For the synthesis, 400 Hz completes two cycles in five milliseconds, 600 completes three, and 800 completes four. All return to their starting phase after five milliseconds. The combined waveform can therefore repeat at that interval without containing a sinusoidal component at the corresponding 200 Hz. “Repeats every five milliseconds” and “contains a 200 Hz sine wave” describe different properties.

This does not mean a brain literally runs the arithmetic in this paragraph. It is a description of information available in the stimulus. Competing accounts of pitch perception ask how frequency structure, temporal information and neural processing contribute under different conditions.

The researchers have to rule out shortcuts

One complication is distortion. A playback system or the ear's nonlinear responses can create additional components, including combination tones. A careful experiment must therefore ask whether listeners are using the intended harmonic relationship or an unintended cue.

Bonnie Lau and Lynne Werner's infant study tested missing-fundamental discrimination while changing spectral details, adding masking noise and limiting spectral-edge cues. These controls matter as much as the striking age of the participants. A response that survives relevant cue changes gives a different kind of evidence from a response to one unchanging pair of sounds.

The home examples here are demonstrations, not replications of that experiment. They do not include its masking conditions or behavioral procedure. Their value is to make the stimulus distinction audible and inspectable. They cannot diagnose an individual's hearing or settle a theory of the auditory system.

“Too high to carry pitch” was a testable assumption

In a 2011 experiment, Andrew Oxenham and colleagues found robust pitch judgments for harmonic complexes with fundamentals below 2 kHz even when all components were above 6 kHz. The authors used that result to challenge established limits in explanations of pitch. The finding concerns specified stimuli and tasks, rather than a claim that every high-frequency sound gives an equally clear note.

That kind of experiment reveals the scientific opportunity hidden in an illusion. Removing a component is not only a trick. It changes the evidence available to a listener in a way that can distinguish predictions. The result becomes more informative when the experiment specifies what remained, what was removed and which alternative cues were controlled.

A missing bass component leaves a useful distinction behind: the world delivers a structured signal, and perception extracts properties from that structure. Hearing a note is not always finding a matching line in a spectrum. Sometimes it is recognizing a relationship whose most obvious member is absent.

Sources and a closer look: UNSW: pitch, harmonics and missing fundamentals; Lau and Werner: controlled infant pitch experiments; Oxenham and colleagues: high-frequency harmonic pitch.

Explore art, experiments and other unexpected connections at Incoprea.

The Sound That Seems to Keep Climbing Forever

The sound takes another step upward. Then another. It returns to where it began, yet the next step still seems to rise. A Shepard sequence can give the impression of climbing without reaching a higher final floor. The impossibility belongs to the interpretation of a changing mixture, not to a physical frequency increasing beyond every limit.

The metaphor of a circular staircase is useful if it does not conceal the mechanism. There are several tones at once, spaced by octaves. Their strengths change across the spectrum so that the high and low edges become inconspicuous. The sequence gives local evidence of upward movement while making absolute height harder to pin down.

An imagined circular staircase made from piano-key-like steps evokes repeated ascent.
Architectural metaphor. The accompanying sound is an original synthesized Shepard-style demonstration; the artwork is not an acoustic diagram.

An original 24-step Shepard-style sequence

Two traversals of a twelve-step pitch-class cycle. The octave-spaced sinusoids use a fixed smooth amplitude envelope; components fade at the range edges. This short file stops normally and does not autoplay or loop.

Listen at a comfortable low level. Before looking at the construction below, note whether the second traversal feels higher, similar, or less convincing than the first. There is no required reaction. A listener can follow one component, notice a reset, or experience a strong overall ascent. Those reports ask different questions about the same signal.

One name, several heights

A musical C can occur in many octaves. The note name identifies pitch class; the octave helps specify height. Tamara Smyth's UC San Diego explanation describes Shepard tones as octave-separated sinusoids beneath a fixed spectral envelope. As their pitch classes move, low components enter quietly and high components leave quietly. After twelve semitone steps the pattern can return to its beginning.

The quiet edges do important work. Imagine a line of people walking up an escalator while the lowest person joins behind a curtain and the highest disappears behind another. If you follow the middle group, you see continual upward movement without clearly seeing the membership change. The sound uses an analogous redistribution of components, though the auditory experience is not literally a visual tracking process.

In the sequence here, the twelve pitch-class states are repeated. The physical ingredients do not march to infinitely high frequencies. What repeats is a set of mixtures arranged so adjacent states support an ascending judgment. Repetition and perceived direction can coexist because judging a small step is not the same task as assigning an absolute position to the whole mixture.

What an experiment can ask that a demo cannot

The Praat reference entry identifies Roger Shepard's 1964 paper, Circularity in Judgments of Relative Pitch. The crucial phrase is “judgments of relative pitch.” A laboratory can present tone pairs in controlled orders and measure the pattern of higher/lower responses rather than rely on one person's impression of an endless scale.

For a simple paper model, draw twelve positions around a clock. Mark each neighboring clockwise step “up.” Following those local labels eventually returns you to the same position. The diagram does not prove the auditory illusion; it clarifies the logical shape of the result. A consistent relationship between nearby pairs need not create one globally ordered line.

Pitch circularity is not confined to one sound recipe

Diana Deutsch, Kevin Dooley and Trevor Henthorn's 2008 study produced circularity with tones containing full harmonic series, using changing relative harmonic amplitudes. Sixteen participants judged ordered tone pairs. This was a different construction from the classic octave-spaced mixture, and the study examined individual differences as well as the overall pattern.

That extension matters because it separates a perceptual question from one famous demonstration's engineering. If several stimulus families can produce related judgments, an account must explain more than one clever audio file. It also warns against treating the staircase image as a literal recipe: different physical constructions can support a similar perceptual relationship.

The original demonstration in this article uses the simpler octave-spaced approach. It does not replicate the 2008 harmonic-amplitude experiment. Naming that boundary lets you compare the methods without confusing shared vocabulary with identical stimuli.

Why the illusion is useful to a composer

A composer can exploit a directional impression without literally exhausting the instrument's register. The effect may suggest building tension or movement, but a description of the synthesis cannot dictate a listener's emotion. Loudness, harmony, rhythm, context and personal associations still participate.

The same caution makes the illusion more rewarding. It is possible to understand exactly how the file is constructed and still hear a compelling rise. Explanation does not have to erase experience. It can give you two parallel ways to follow it: the frequencies and amplitudes cycling through a bounded arrangement, and a percept that keeps interpreting the next local step as upward.

Sources and a closer look: UC San Diego: Shepard-tone construction; Praat: Shepard 1964 bibliographic reference; Deutsch, Dooley and Henthorn: harmonic-series pitch circularity.

Explore art, experiments and other unexpected connections at Incoprea.

Why the First Echo Usually Wins

A person speaks in a room. Sound takes the direct route to your ears, then arrives again after bouncing from walls, ceiling and furniture. Yet you usually hear a person in one place, rather than a crowd of equally convincing copies. The room supplies repeated arrivals; perception organizes them into a usable event.

The precedence effect describes how earlier arriving sound can dominate perceived location when closely followed by related sound. The later arrival is not simply deleted. It can affect loudness, spaciousness or other qualities even when it is not heard as a separate source.

A speaker in a wooden recital room is surrounded by a conceptual wash suggesting reflected sound.
Room illustration. Curved washes are metaphorical, not calculated acoustic paths. Audio files are original controlled timing examples.

The room is full of extra paths

Start with a geometry example. If one reflection travels 3.43 meters farther than a direct sound, it arrives about ten milliseconds later using a rounded sound speed of 343 meters per second. The value changes with air conditions, and a real room offers many paths. The calculation shows that apparently simultaneous listening can include physically ordered arrivals.

Diana Deutsch's account of auditory illusions describes the classic two-loudspeaker arrangement: related signals arrive with a short delay, and listeners can perceive one event localized toward the leading source. Increase the delay sufficiently and a separate echo may become apparent. A specific transition depends on the signal and conditions; “the echo threshold is always X milliseconds” is an unsafe shortcut.

Fusion and location are different questions

The review by Ruth Litovsky and colleagues distinguishes aspects of precedence behavior rather than treating it as one switch. Whether two sounds fuse, where an event appears, and how well a listener can discriminate changes in a lagging source are related but different experimental questions.

Imagine answering three separate prompts after a paired sound: “How many events?” “Where?” and “Did the second source move?” A person might report one event, locate it near the first source, yet still retain some information about the later sound. The labels help prevent the misleading statement that the brain ignores everything after the first arrival.

That distinction is useful beyond the laboratory. A reflection can be perceptually bound to a voice and still alter the room's character. “I do not hear a separate echo” does not establish that the room has made no audible contribution.

Hear the timing ingredients

The following original stereo signals provide a timing comparison. They are not a replication of a free-field two-loudspeaker experiment. Headphones send channels to ears differently from loudspeakers in a room; a phone may sum both channels into one output. Start quietly. Each file contains three brief, gently faded noise-burst pairs.

Equal channel timing

The same burst starts in both channels together.

Right channel delayed by 2 milliseconds

The left channel leads; the other burst is a digitally delayed copy.

Right channel delayed by 10 milliseconds

Compare number of events, apparent position and sound quality separately.

Right channel delayed by 50 milliseconds

A larger separation makes the timing easier to inspect, but does not establish a universal echo threshold.

If you cannot distinguish positions, record that rather than infer a problem with your hearing. Check whether the playback actually has separate stereo channels. If you hear differences in texture but not event count, that is also a meaningful description of the demonstration. The physical delay is specified; your perceptual report is a separate observation.

A developing listener need not use the same cues identically

An experimental comparison of children and adults examined precedence behavior in complex localization tasks. The findings connect to development of spatial hearing, but they do not turn a home echo demonstration into an age test. The controlled task, comparison groups and stimuli are essential to interpreting a result.

This is a recurring strength of perception research. It can take a familiar ability—finding a speaker in a room—and separate it into conditions precise enough to reveal differences. It does not have to assume that the everyday success is produced by one unchanged rule across all people and environments.

The first arrival is valuable because it often offers a relatively direct clue to the source. But hearing has to operate in a world where reflections carry useful information too. The interesting achievement is not eliminating the room. It is keeping a voice locatable while still allowing the space around it to be heard.

Sources and a closer look: Litovsky and colleagues: the precedence effect review; Diana Deutsch: precedence and auditory illusions; Experimental comparison of children and adults.

Explore art, experiments and other unexpected connections at Incoprea.

The Mouth That Changes What You Hear

An anonymous speaking mouth and ear overlap in a conceptual paper collage.
Audiovisual-perception illustration. This still image is not a McGurk test; use the credited moving-image demonstration for that comparison.

A face appears to say one syllable while the voice says another. Some listeners hear a third result, neither a simple copy of the sound nor a silent reading of the lips. The McGurk effect turns an ordinary act—watching someone speak—into a question about how the senses cooperate.

Try it before choosing an answer

The BBC's video demonstration gives a short audiovisual example. Listen once while watching the face, then once with the image covered or your eyes comfortably closed. Keep the volume unchanged. Write what you heard in your own terms before selecting among suggested syllables. Use the video only if its audio and picture are synchronized.

BBC audiovisual demonstration, hosted on YouTube. If playback is unavailable, use the original demonstration link above.

A classic experimental pairing combines an auditory “ba” with visual movements associated with “ga.” A listener may report a fused percept such as “da.” The exact result depends on the recording, listener and response task. It is a striking example of audiovisual speech perception, but the useful question begins where the claim “everyone hears this” ends.

The generated hero illustration cannot produce the effect: it is a visual introduction, not a speech stimulus. A proper comparison needs moving articulation and a specified sound track. Likewise, silently reading this paragraph and imagining the syllables is a different task from hearing the recording.

If your percept does not change, that is not a failed attempt to be a good audience member. The demonstration's value does not depend on persuading every reader to report the expected result. A difference among listeners is one of the things researchers have to explain.

The sensory information can stay still while the task changes

Laura Getz and Joseph Toscano's 2021 study varied response format, stimulus set and testing environment while using the same eliciting stimuli. The frequency of fusion reports varied substantially. Their experiments challenge the assumption that a standard-looking clip measures one context-free susceptibility.

Consider the difference between “What did you hear?” and “Was it ba, da or ga?” The second question supplies categories and may make a blended or uncertain impression fit a ready-made box. That does not mean all forced-choice studies are invalid. It means a study's response procedure is part of its method, not an invisible administrative detail.

For your own viewing record, preserve both stages. First write a free description; only afterward compare it with conventional labels. “Between two syllables” contains information that disappears if you force it prematurely into a single answer. Confidence is useful too: a tentative label and an unmistakable percept should not automatically be treated as identical experiences.

A person and a clip form a combination

A 2015 study of variability and stability examined 360 participants and 20 McGurk stimuli. Responses varied with participants, stimuli and response conditions. The large stimulus range makes an important point: one clip's success does not establish that a listener reacts the same way to every audiovisual mismatch.

This is where a richer account differs from calling the brain “easily fooled.” Speech perception normally has to combine changing evidence. In everyday conversation, a moving face and a voice usually belong to one person. A laboratory mismatch creates a useful conflict among cues that are ordinarily correlated. The result tells us something about that combination; it does not show that vision always defeats hearing.

Research on individual susceptibility has also tested proposed perceptual and cognitive correlates. The authors emphasize that the sources of individual differences remain incompletely explained. A home reaction to a clip is therefore not a personality test, a measure of intelligence, or a general ranking of sensory ability.

What changes?What the comparison can ask
The face is visible or coveredDoes visual speech affect this auditory report?
The answer choices changeHow does the response task shape the recorded result?
The clip changesDoes the same listener respond similarly across stimuli?
The synchronization changesAre the cues still being presented as the intended event?

What this teaches a video maker

The practical lesson is not to produce an illusion whenever a person talks on screen. It is to treat the relationship between image and sound as meaningful information. A dialogue edit that changes a visible articulation while retaining another sound can create a perceptual conflict even if both tracks seem individually plausible.

A useful production check compares the exact sound track with the visible face at normal playback speed. If a viewer reports an odd consonant, do not assume the transcript alone settles the experience. Listen without the picture, then review the combined event. Those two checks answer different questions about what the audience receives.

This is an editorial inference from the demonstration, not a quantified promise about every dubbing error. Natural speech is richer than a repeated isolated syllable, with word meaning, sentence context and many opportunities for correction. The laboratory effect opens a question; it should not swallow the whole subject of conversation.

The mouth that changes a heard syllable reveals a constructive process: perception makes sense of evidence across more than one channel. Its variability is part of the discovery. The result becomes deeper when we ask not only what someone heard, but which face, which voice, which timing and which question produced that answer.

Sources and a closer look: BBC: audiovisual McGurk demonstration; Getz and Toscano: task-dependent McGurk reports; Variability and stability across participants and stimuli; Individual differences in susceptibility.

Explore art, experiments and other unexpected connections at Incoprea.

How an Obvious Change Can Vanish While You Look

Two related painted reading rooms evoke the difficulty of comparing views across an interruption.
Conceptual room comparison. Artistic details vary; use the separate original shape diagrams for the precisely specified comparison.

A room changes while your view is interrupted. When the room returns, it feels like the same scene. The missing object or altered color may be large, yet the change can remain surprisingly hard to identify. Change blindness is not simply failing to see a tiny mark. It is failing to notice a difference between successive views.

The distinction matters because it challenges a familiar inner picture: that vision stores a detailed photograph, compares the next photograph with it, and automatically flags every mismatch. People can retain useful scene information without producing a conscious report of a particular change.

A small comparison you can control

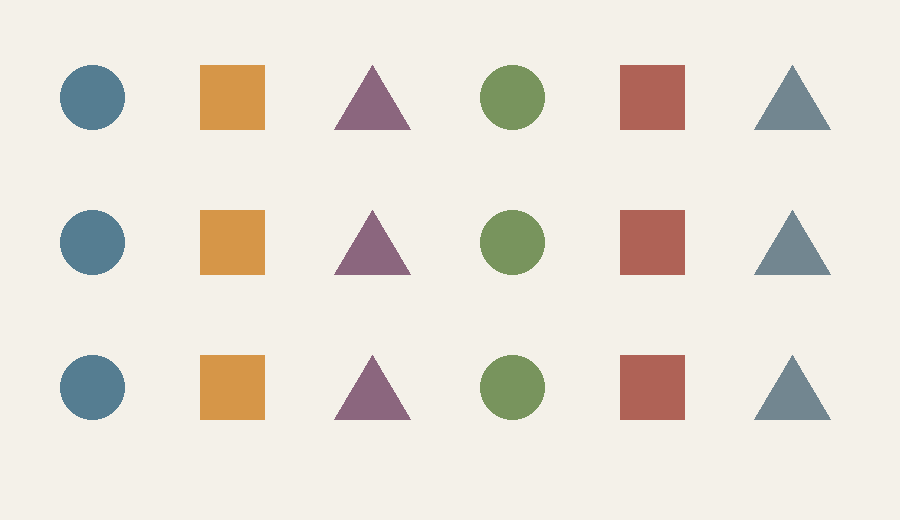
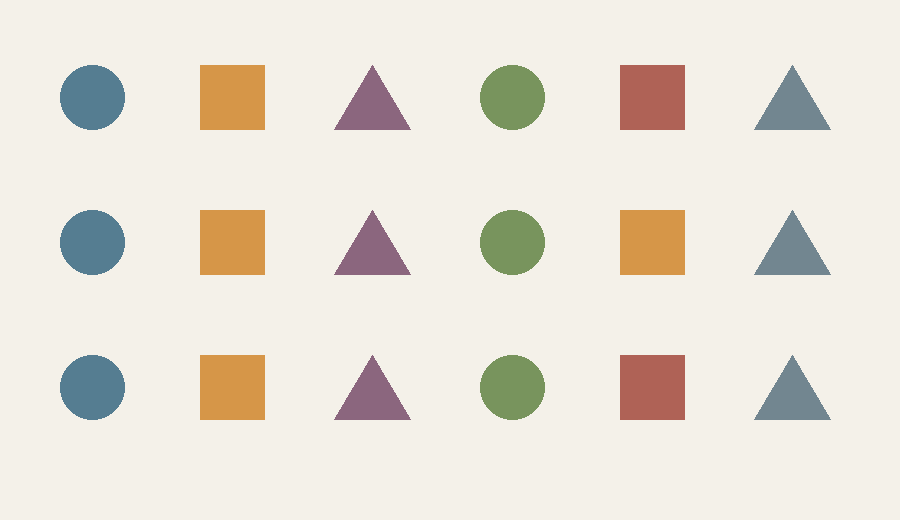
The following two diagrams are original and differ in one specified feature. They are deliberately simple rather than a replica of a published experiment. Look at View A for about ten seconds. Then look away, open View B and try to name the change before returning to the first view. There is no automatic flashing or timer.

View A: eighteen colored shapes arranged in three rows and six columns.
View A. Original deterministic diagram; the changed feature is specified in the answer below.
Open View B after looking away
View B: the same shape grid with one square changed in color.
View B. Compare your memory first; then return to View A if you want to inspect directly.
Reveal the exact change

The square in row 2, column 5 changes from muted red to ochre. Shape, size, position and the other seventeen objects remain unchanged. This informal exercise has no normative score and cannot establish a person's attention ability.

Whether you found it immediately or needed a second look, notice how the task changes when both views are available for deliberate comparison. Now you can search one cell at a time. The first attempt relied more heavily on what you encoded and retained across the interruption.

The interruption can hide the useful change signal

Daniel Simons's Visual Cognition Lab describes how disruptions such as a blank interval, eye movement or movie cut can conceal the visual signal that would otherwise draw attention to a change. Under an uninterrupted transition, an appearing or disappearing object may announce its own location. An interruption can make that local signal harder to separate from the overall visual change.

Ronald Rensink's research summary of alternating-scene experiments describes large, repeated changes that remain difficult to find when views are separated by blanks. Knowing that a change exists does not automatically tell attention where to go. That difference between expectation and effective search is central to the experience.

The grid above avoids claiming to reproduce those experimental timings. It asks a simpler question about your remembered comparison. The generated room painting at the top is looser still: it is an illustration with multiple artistic differences, not a controlled stimulus. Keeping those roles separate prevents a beautiful image from masquerading as an experiment.

The effect can survive outside a screen

In Simons and Levin's 1998 real-world study, a brief interruption during a conversation allowed the person asking for directions to be replaced. Some participants failed to report the substitution. The result showed that a natural interaction with an attended person could still support change-detection failures under the tested circumstances.

The important conclusion has limits. It does not say people never recognize faces or that all social interactions are visually empty. It shows that maintaining the meaning of an ongoing task—giving directions—can coexist with missing a substantial visual change. Context and attention shape what is encoded and compared.

Anecdotes often enlarge such findings into “we see almost nothing.” That is too broad to be useful. The interesting question is which information remains available, how the change is masked, and what task the observer is performing. Failure to report one alteration does not demonstrate the absence of every representation of the scene.

Change blindness has a neighboring phenomenon

The lab distinguishes change blindness from inattentional blindness. In the latter, a person focused on one task can miss an unexpected event already in view. In change blindness, the task involves a difference across views. Both concern attention and awareness, but exchanging the names blurs what the experiment manipulated.

The lab's own video page offers separate demonstrations and study illustrations. Follow its instructions before reading explanations if you want to preserve the first-view experience. The videos remain with their creators; this article links to them rather than duplicating their recordings.

The room that seemed unchanged asks an unexpectedly practical question: what did your task make worth retaining? Vision is extraordinarily useful without being a continuously refreshed photograph of every detail. A deliberate comparison can help precisely because noticing a change is an achievement, not an automatic consequence of having looked.

Sources and a closer look: Visual Cognition Lab: attention and change research; Rensink: alternating-scene findings; Simons and Levin 1998: changes during real-world interaction; Visual Cognition Lab: creator-hosted demonstrations.

Explore art, experiments and other unexpected connections at Incoprea.

A False Touch Can Hop Along Your Arm

The taps land near the wrist, then farther up the arm. Under the right timing, a person can feel touches at intervening places that were never physically tapped. The cutaneous rabbit gets its name from that apparent hopping path. No animal, nerve impulse or pressure wave has traveled along the skin in the way the percept suggests.

This is an unusually clear separation between where stimulation occurred and where touch seemed to occur. It turns a familiar sense into a measurement problem: the experimenter controls physical contacts, while the participant reports an experienced location. The two maps can differ systematically.

A relaxed forearm, soft ripple motifs and a paper rabbit evoke a tactile illusion.
AI-generated metaphorical illustration. Ripples do not show actual neural activity or a stimulus sequence; the source studies provide the controlled arrangements.

A sequence has a shape as well as a count

Imagine two locations labeled A and B along a forearm. A rapid sequence includes several contacts at A followed by contacts at B. An observer's report can spread perceived events through the space between them. The precise effect depends on timing, pattern and arrangement; tapping randomly by hand is not a guaranteed reproduction.

For a thought experiment, draw A and B on a line. Underneath, write an actual-contact sequence such as A, A, A, B, B. On another line, draw a possible reported path with intermediate locations. Keep the two records visibly separate. One is the experimenter's stimulus log; the other is a perceptual report. A good account needs both, including the response uncertainty.

Now make a prediction before consulting an explanation: would a longer pause between the groups make a continuous hopping path more or less compelling? That question changes one temporal relationship while preserving the two physical sites. It illustrates how an illusion becomes an experiment rather than only a surprising story.

The map appears in brain activity too

Felix Blankenburg and colleagues' 2006 study used functional MRI to investigate a rabbit sequence on the forearm. Compared with control stimulation at the same skin sites in a different order, the illusion condition produced activity in a primary somatosensory location corresponding to the perceived intermediate area. The authors also compared it with actual stimulation of that intermediate position.

That is stronger evidence than a participant merely agreeing with a suggestive question, but it is still a specific result. It does not mean an MRI image directly displays a private experience in complete detail, or that one cortical patch alone explains the percept. The controlled comparison connects a reported spatial illusion with a mapped neural response.

The experiment's order control is especially instructive. If the contacts occur at the same physical sites, but changing their order changes the resulting perception and activity, an explanation cannot depend only on which receptors received a contact. The organization of events over time matters too.

A model can prefer plausible motion

Daniel Goldreich and Jonathan Tong's modeling work explores tactile space-time illusions through Bayesian estimation with a preference for lower speeds. When measurements are uncertain, a model combines incoming evidence with expectations. Closely spaced events separated by a large physical distance can be estimated as a shorter traveled distance.

The phrase “the brain expects slow motion” is only a rough description of a proposed computational account. It is not evidence that a listener consciously chooses to imagine a rabbit. The model is valuable because it produces quantitative predictions that can be compared with reported locations and timing effects.

For an original analogy, suppose a blurry tracking system observes an object at two widely separated positions only a very short time apart. It might infer a very fast journey. Alternatively, if its position measurements are uncertain and its usual objects move slowly, its best estimate may pull the positions closer together. The analogy clarifies inference under uncertainty; it does not claim that touch uses a literal camera or software routine.

The body is not always the whole reported path

Miyazaki, Hirashima and Nozaki's study extended the question to an arrangement involving a stick held between fingers. Under their conditions, participants reported an illusory tapping progression along a region outside the skin. That result complicates an explanation restricted to interpolation between adjacent points on a skin map.

It does not establish that every held object is automatically incorporated into perception in the same way. The experimental arrangement is the evidence. Its broader invitation is to ask how touch, posture and an object's relationship to the body contribute to experienced location.

RecordWhat belongs there
Physical stimulationContact location, order, time and intensity
Participant reportPerceived number, location, movement and uncertainty
Model predictionEstimated locations under specified assumptions
Neural measurementA signal compared across defined experimental conditions

Why a controlled sequence is better than a party trick

Manual tapping can vary in pressure, timing and contact area. An unsuccessful home attempt therefore cannot decide whether a published effect exists; a successful one cannot tell you which mechanism produced it. The most useful reader activity here is to compare the stimulus and reported-location diagrams in the source papers, then ask which variables their controls preserve.

That habit transfers well. Whenever an article says a sensation occurs “where nothing happened,” look for the physical log, the response method and the comparison condition. The most surprising experience becomes more meaningful when its boundaries are visible.

The rabbit leaves no footprints on the skin. Its trace is the difference between a delivered sequence and an organized percept. That difference reveals touch as a process that locates events in time, space and a body-related world, rather than merely labeling each contact point in isolation.

Sources and a closer look: Blankenburg and colleagues: somatosensory cortex experiment; Goldreich and Tong: Bayesian space-time model; Miyazaki and colleagues: rabbit outside the body.

Explore art, experiments and other unexpected connections at Incoprea.
Braille Is Read With Movement, Not Just Sensitive Skin

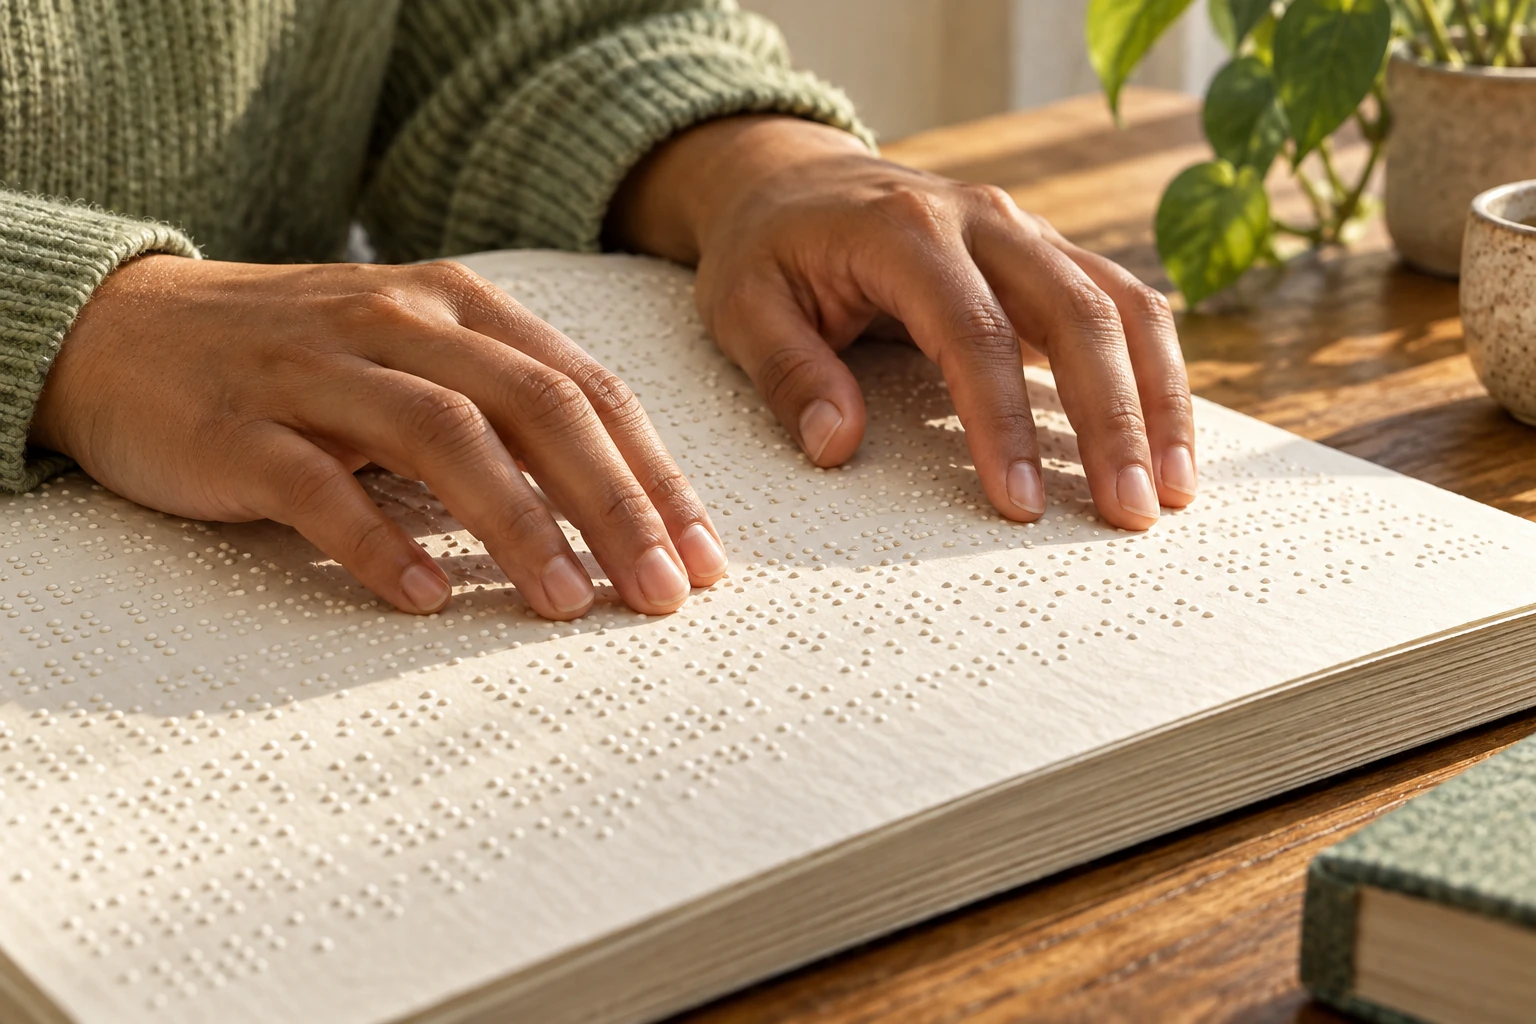
A fingertip pauses over a raised dot. Another fingertip moves through a line. Both touch the page, but only the second action begins to suggest how skilled braille reading works. The reader gathers changing tactile information through movement, while language and hand coordination give that information a useful structure.

It is easy for a sighted observer to focus on the visible dot pattern and miss the activity that makes it readable. Braille is a writing system, not a test of whether someone has unusually sensitive skin. Its use combines learned symbols, material standards, movement and comprehension.

Two hands move across an embossed page on a wooden reading desk.
AI-generated editorial illustration. Dot patterns are illustrative and do not constitute a verified readable braille text.

A small cell opens a large design space

The Library of Congress exhibition shows six-dot cells arranged in two columns, along with slates, styli and braillewriters. A cell's positions are conventionally numbered 1,2,3 down the left and 4,5,6 down the right. Patterns of present and absent dots can carry different meanings within a braille code.

Six binary positions offer 2×2×2×2×2×2=64 possible patterns, including the blank. That arithmetic is a design-space count, not a promise that all 64 patterns simply equal 64 letters. Context, indicators and contractions can extend what a system expresses. Different language and technical codes use the available patterns according to their own rules.

A visual drawing can help a newcomer understand the arrangement. It cannot reproduce the tactile experience of properly embossed material. A printed imitation made from dark circles is still ink on a page. Even handmade raised dots need appropriate dimensions and consistency to function as reliable reading material.

Reading changes the signal reaching the skin

In a 2021 longitudinal study, Tetsushi Nonaka, Kiyohide Ito and Thomas Stoffregen recorded the reading-finger movements of eight congenitally or early blind children over twelve months. They related features of movement variability and finger orientation to reading performance. The findings concern an active process, not just a stationary fingertip's resolution.

The sample is small and the relationships do not establish one ideal motion that every reader should copy. They do show why treating movement as incidental would miss measurable aspects of performance. Which part of the fingerpad contacts the dots, how that contact changes, and how the reader advances all belong in the question.

Think of a ridged surface under a moving fingertip. Its spatial pattern becomes a sequence of changing skin deformation. Vary the movement and the temporal input changes too. This is an explanatory analogy, not a substitute for a braille lesson: skilled reading adds learned linguistic structure and practiced strategies that an unfamiliar texture lacks.

Sensitivity is only one part of the account

Van Boven and colleagues' study of tactile spatial resolution measured fingertip acuity in braille readers and comparison participants. It reported enhanced spatial acuity in the tested blind braille readers and discussed experience-related adaptation. That is useful evidence about a measured tactile task, but it does not reduce reading ability to a single acuity score.

Reading a sentence involves recognizing symbols, preserving order, interpreting contractions and understanding language. A fingertip could distinguish a small pattern without its owner knowing what it means. Conversely, a reader's expertise includes managing uncertainty and using context rather than treating every character as an isolated object.

Research on the kinematics of the reading finger also examines language and perceptual-motor contributions together. Its framing helps avoid an unhelpful split: movement is neither a purely mechanical conveyor belt nor a direct transcript of every linguistic operation.

QuestionKind of evidence needed
Can a fingertip distinguish nearby features?A controlled spatial-acuity task
How does the reader scan?Movement and contact measurements
What was understood?A reading-comprehension task
Is the page usable?Accurate material plus evaluation by braille readers

Tools change the page, not the need for literacy

The Library of Congress collection includes the slate and stylus, a Perkins Brailler, musical material and tactile publications. These objects make a useful gallery trail: compare the action used to produce a pattern with the action used to read it. A machine's six keys do not mean its operator types a conventional printed letter with one matching key.

Contemporary refreshable displays can present changing tactile cells rather than an entire embossed page. That changes storage, navigation and interaction, but the core lesson remains: accessible output must preserve meaningful reading conditions. A visual designer cannot validate a tactile product by deciding that the dots look attractive on a screen.

The moving fingertip is doing more than receiving a sequence of bumps. It is participating in a practiced way of reading. Looking closely at that action replaces a story about extraordinary sensation with a more useful one about literacy, skilled movement and the material conditions that let a reader use a text.

Sources and a closer look: Library of Congress: braille objects and writing tools; Nonaka and colleagues: scanning movements in children; Van Boven and colleagues: tactile spatial resolution; Linguistic and perceptual-motor contributions to reading-finger motion.

Explore art, experiments and other unexpected connections at Incoprea.
The Elevator With Three Working Buttons

Case 50 · shortest-path challenge · Hard · About 10-15 minutes The archive elevator has a peculiar test mode. Its floor display works, but o...