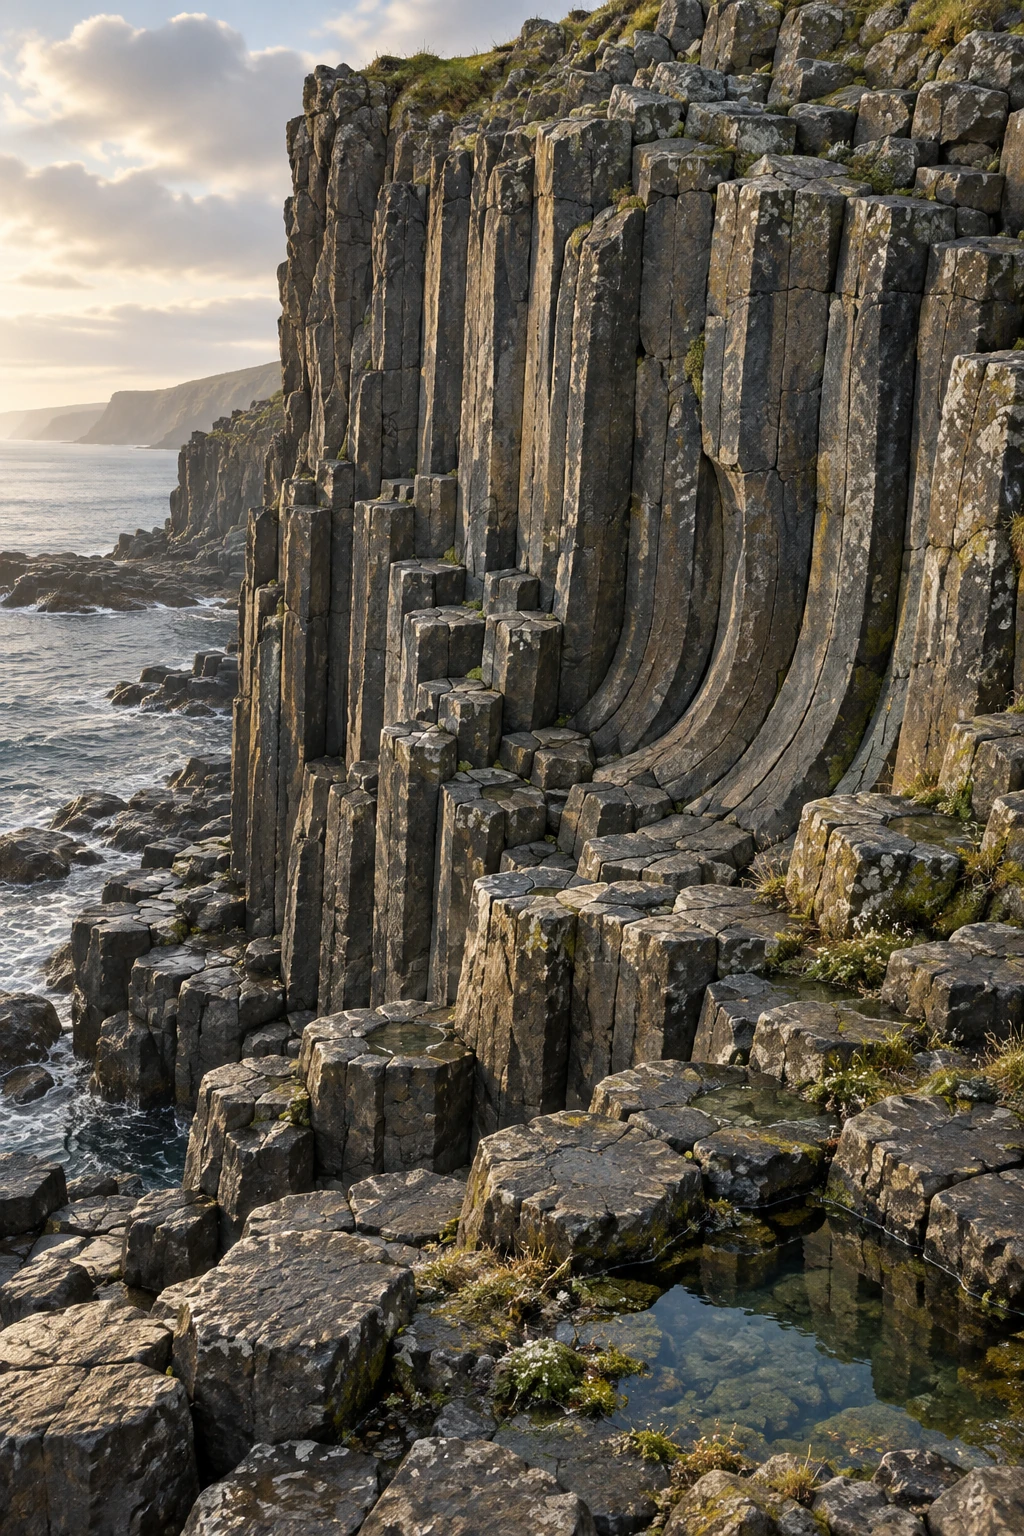
A basalt cliff can resemble a bundle of stone pencils. From above, the pencil ends form polygons; from the side, their joints can run in long parallel lines or bend into fans. The geometry looks designed, yet it records the advance of cooling and fracture through hot rock.
The columns are not crystals grown to giant size. They are pieces of rock separated by a three-dimensional joint network. Understanding that distinction opens a more interesting question: how does a crack pattern keep organizing itself as it moves deeper?
Solid rock still has cooling to do
Lava loses heat from its margins, solidifies, and continues to contract as solid rock cools. If the surrounding material prevents free contraction, tensile stress develops. Fractures release some of that stress.
The USGS explanation of columnar jointing describes cracks advancing inward from cooling surfaces in discrete events. The visible columns are the geometry left behind as this fracture front migrates.
The word “cooling” should not suggest that molten lava simply freezes into ready-made hexagonal rods. Solidification, further thermal contraction, stress buildup, and crack propagation are related but distinguishable stages. The joints tell a history after the rock acquired enough strength to fracture.
Why the columns point the way they do
Columns commonly extend roughly perpendicular to cooling surfaces. If the cooling boundary is horizontal, the result may be vertical columns. If the boundary curves, the joints can change orientation and produce fanning or bent forms.
The National Park Service overview includes columnar jointing in several volcanic rock settings, not only basalt. A column’s orientation therefore needs to be read against its geological context rather than assumed to point vertically in the original flow.
A useful field question is where heat could escape. Was the rock against a valley wall, beneath a cooled upper crust, over cooler ground, or in contact with water or ice? The joint pattern can constrain that story, though several processes may have influenced it.
Why approximately hexagonal?
As neighboring cracks interact and the front advances, the pattern can reorganize. Mature networks often have many six-sided columns, but five- and seven-sided sections and other irregularities remain. A natural outcrop is not a perfect honeycomb.
Goehring and colleagues’ study of basalt joint scaling compares field observations, laboratory analogs, and thermal models. It treats the geometry as a dynamic fracture problem, including how crack spacing relates to the advancing front.
This is more useful than saying “nature prefers hexagons” and stopping. That slogan names a familiar outcome but does not identify the material, stress, transport, or evolving boundary conditions that produce it.
A kitchen material helps investigate a volcanic pattern
Drying starch slurries can form columnar fracture patterns. Water loss plays an analogous role to cooling-induced contraction, allowing researchers to control conditions and observe structures too slow or inaccessible to watch easily in a lava flow.
Laboratory experiments on columnar-joint scaling examine how the drying conditions influence column size. The analogy is not an assertion that lava and starch have identical properties. It isolates a shared problem of shrinkage, transport, and a moving fracture front.
Laboratory control also helps distinguish correlation from mechanism. If a changed drying rate alters the pattern under controlled conditions, researchers can compare that response with expectations from field cooling histories. The analog gains value through the match of relevant physics, not the visual similarity alone.
Read the joints as a sequence
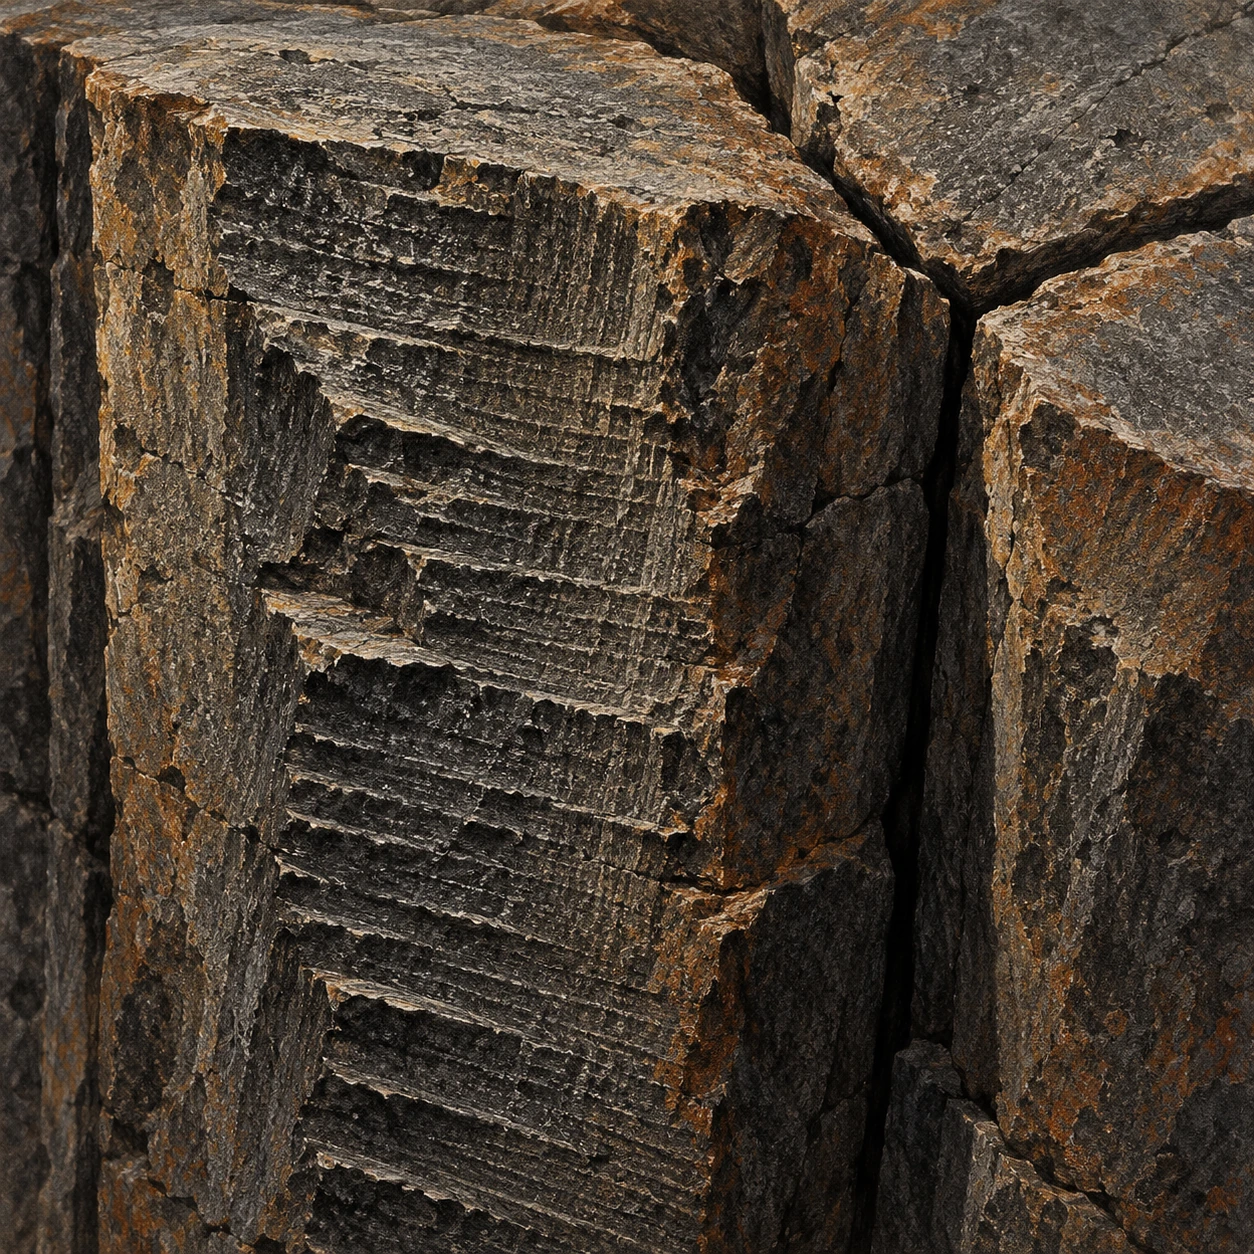
First look: where do three cracks meet? At a T-shaped junction, one crack can terminate against another. At a roughly Y-shaped junction, three directions meet at angles closer to 120 degrees. Goehring’s study of evolving fracture patterns explains how repeated small adjustments can turn a more rectilinear network toward a more hexagonal one. The result records an evolving process, not a shape selected in one instantaneous decision.
Second look: what is written on a side? A column face can preserve striae associated with incremental crack advance. Instead of treating the side as a smooth rod, look for small repeated steps. They offer another scale of evidence: a long column can have formed through many short fracture events.
Third look: was the material still liquid? Lamur and colleagues’ laboratory investigation combined thermal and mechanical measurements to examine when basalt fails during cooling. Their tested material fractured below its solidus, supporting joint formation in solid rock that still had considerable heat to lose. The experimental temperature range belongs to that material and setup, not to every columnar outcrop.
A photograph can become a fracture notebook
Choose a published close-up in either study. Make three passes over it. In the first, mark candidate junction types. In the second, mark possible striae without assigning a temperature. In the third, note which features you cannot distinguish because of weathering, lighting, or the viewing angle.
Then try a useful question: could an apparent small step be a later weathering feature rather than a primary fracture mark? A photograph may not decide. A fresh fracture surface, matching marks on neighboring faces, or a broader field relationship would add information. Keeping alternatives does not make the notebook indecisive; it states what evidence would improve it.
Why is a perfect hexagon count an incomplete answer?
It describes a cross section but loses the sequence through depth. Two exposures with similar side counts can differ in junction development, striae spacing, cooling boundaries, and later erosion. Pattern statistics become more informative when paired with the rock’s three-dimensional context.
The added close-up deliberately changes the article’s scale. The cliff gives the impression of a great architectural whole. A junction and a stepped face bring the explanation back to local crack interactions. Understanding how those small events continue through the rock makes the larger order more interesting than a slogan about nature liking six sides.
Count the sides without forcing the answer
Use a clearly photographed horizontal exposure of column tops. Select a region before counting, then record the number of sides for every complete visible polygon in it. Put ambiguous or partly hidden polygons in a separate category.
If you choose only the most symmetrical columns, your result will overstate the regularity. If you count a fractured or eroded edge as an original side, you may distort the distribution in another direction. A simple tally becomes a lesson in sampling and classification.
Do not break rock or climb an unstable face for a better view. Existing public photographs can support the exercise, and protected sites often have designated viewpoints. The scientific question is the pattern’s variability, not the acquisition of a souvenir.
Two textures in one flow
A regular colonnade may sit beneath a more irregular, closely fractured entablature. USGS descriptions of Columbia River basalt interiors show these contrasting joint patterns. Different cooling histories, including water involvement, can help create differences within one lava body.
That means a cliff’s upper and lower sections need not be separate eruptions simply because their fractures look different. Conversely, identifying a single flow requires more evidence than matching column shapes. Contacts, composition, textures, and regional mapping belong in the interpretation.
You can also test how much the viewpoint changes the apparent geometry. A vertical face reveals column length and joint direction but may hide the polygonal cross sections. A top surface reveals side counts but says less about how the columns bend below. Combine both views before describing the whole outcrop. A photograph that makes the rock look like an orderly bundle may conceal substantial variation just outside the chosen frame.
A cooling history with uncertainty attached
A broad rule links faster front advance with finer spacing in appropriate regimes, but an exact column diameter is not a universal thermometer or stopwatch. Composition, geometry, heat transport, and the sequence of cooling events complicate the relationship.
Try drawing the same rock body with three different cooling boundaries: flat top, curved valley side, and irregular water contact. Sketch columns normal to each. The exercise makes the fanning shapes less mysterious while leaving the quantitative reconstruction for actual data and models.
The stone pencils are therefore records of movement rather than symbols of stillness. Their rock has stopped glowing, but the joint network preserves a front that once advanced, adjusted, and released stress one crack at a time.
Sources and a next step
- USGS HVO: columnar joints and cooling history
- NPS: columnar-jointing settings
- Goehring et al.2008: scaling of basalt joints
- Goehring et al.2006: laboratory columnar-joint scaling
- USGS: Columbia River basalt flow interiors
Continue exploring art, ideas, and unexpected connections at Incoprea.