Showing posts with label Moon. Show all posts

Thursday, October 22, 2026

The Moon’s Cold Traps: A Place Can Be Dark Without Being Equally Frozen

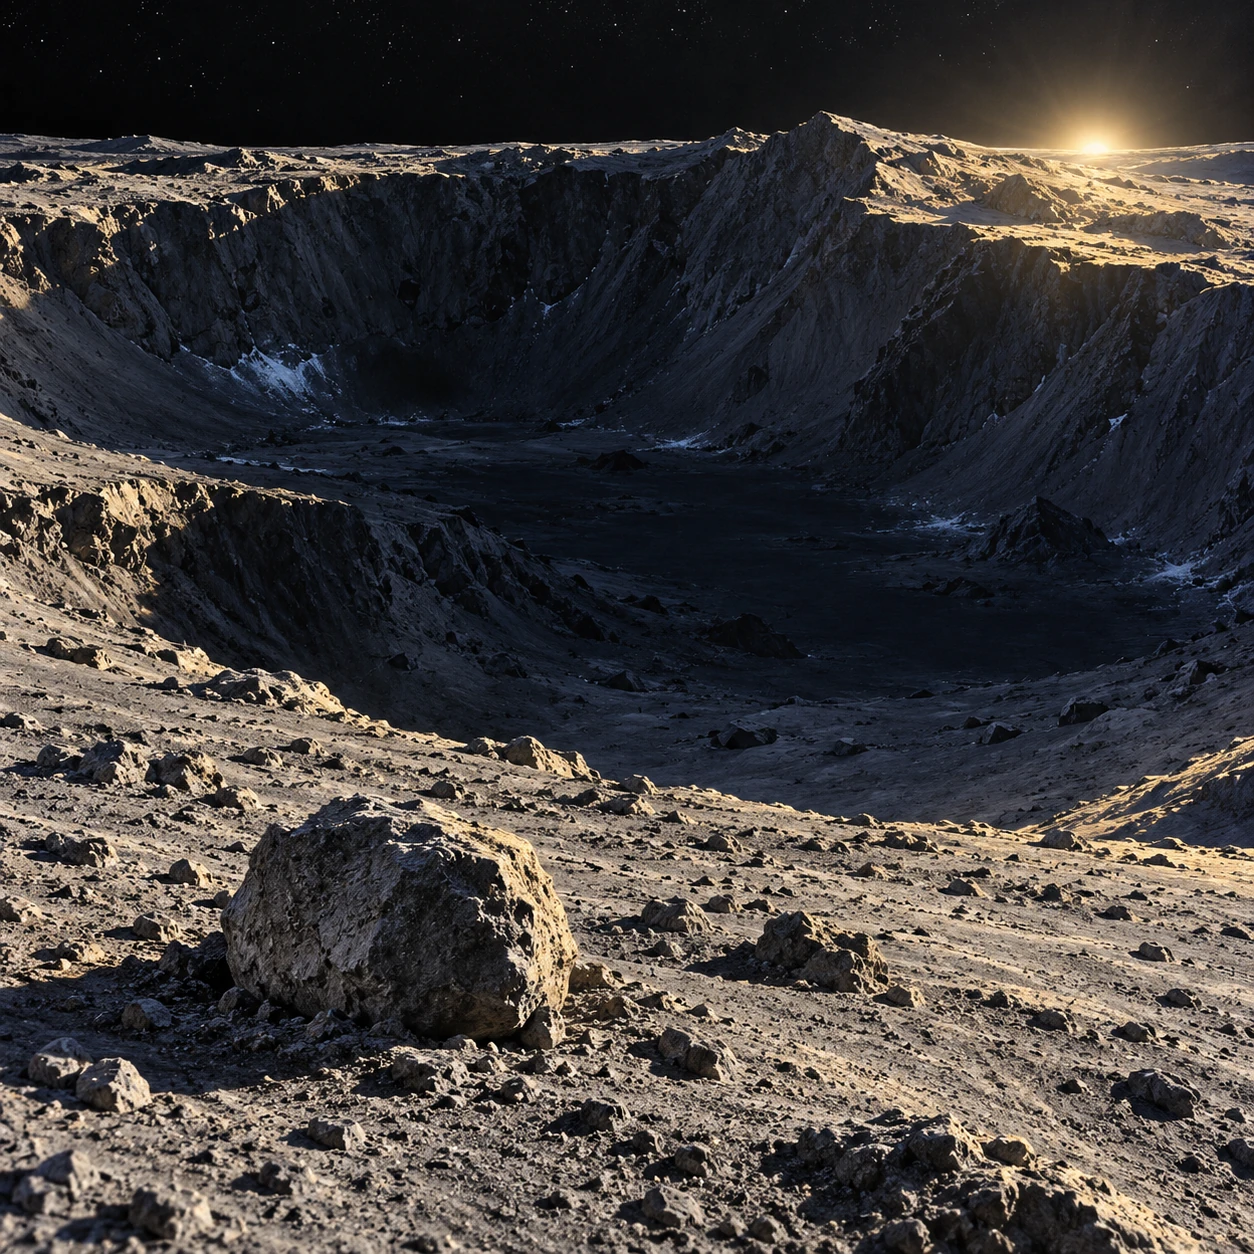
Graphite-and-gouache lunar polar crater with a sunlit rim, dark floor, and small foreground rock shadow containing sparse frost flecks.
Conceptual lunar terrain, not a spacecraft image. Frost patches illustrate possibilities and do not identify a measured deposit.

At the lunar poles, sunlight skims the terrain at a low angle. A crater rim can catch the light while part of the floor remains permanently shaded. Such places may preserve water ice—but darkness alone does not establish that every shadow is a suitable cold trap.

The useful question is thermal and temporal. How warm does the surface ever become, which volatile is being considered, and how long must it survive? A cold trap is a physical environment, not merely a black area in a photograph.

The Moon’s geometry makes unusual shadows

The Moon’s small axial tilt allows some polar depressions to avoid direct sunlight for very long periods. Their temperatures are still influenced by scattered sunlight, infrared radiation from surrounding terrain, conduction, and the changing illumination of nearby surfaces.

A permanently shaded patch can therefore be warmer than another permanently shaded patch. A deep crater surrounded by warm slopes receives a different radiative environment from a small protected hollow elsewhere. Shadow and temperature are related, but they are not interchangeable maps.

Hayne, Aharonson, and Schörghofer’s micro-cold-trap study explicitly models the relationship between shadow sizes and thermal stability. It finds that small-scale shadows can contribute meaningful cold-trap area while also noting that many permanent shadows at lower latitudes are too warm for long-term water-ice accumulation.

Survival depends on temperature through time

Ice can sublimate directly into vapor in the Moon’s near-vacuum. The rate depends strongly on temperature. A brief warm interval can matter disproportionately, so an average temperature may hide the part of the history most important for survival.

Different volatile substances have different stability requirements. A location suitable for one ice is not necessarily cold enough to retain every more volatile compound over the same timescale. Burial depth, the properties of the regolith, and local exchange processes further affect persistence.

NASA’s LRO frost study compares thermal and reflectance evidence. Its emphasis on the hottest conditions rather than a simple average illustrates why a cold-trap assessment needs a temperature history.

Evidence comes in different forms

What a lunar-water observation can establish
ObservationUseful inferenceImportant limit
Hydrogen enrichmentA hydrogen-bearing component may be presentHydrogen alone does not identify every molecular form
Temperature compatible with ice stabilityIce could persist under the modeled conditionsA suitable trap need not contain a deposit
Water-related spectral signatureSupports a particular chemical interpretationAbundance, depth, and spatial mixing still need analysis
Bright, cold surface patchesCan support a frost interpretation with other dataBrightness alone is not a unique ice detector

The strongest account combines independent measurements and asks whether their footprints and depths match. Two datasets can concern the same region while sampling different surface layers or spatial scales.

Small shadows change the inventory

A boulder or small crater can cast a shadow far below the resolution of a continent-style map. Micro-cold-trap research asks how many such features exist, how their temperatures behave, and how much area they add collectively.

This is a scale problem. One small patch contributes little area, but an enormous number of patches may matter. The estimate still depends on surface roughness statistics and the thermal model, so a mapped potential area should not be presented as a measured volume of water.

NASA’s surface-shadow research account explores how local roughness affects water behavior. The practical insight is that the ground’s geometry can matter at scales smaller than the image that first attracted your attention.

A two-patch thought experiment

Imagine two permanently shaded patches with the same average temperature. PatchA varies only slightly, while patchB has brief warmer episodes and otherwise stays colder. Their water-ice survival can differ because sublimation does not respond linearly to temperature.

The example supplies no numerical survival time; calculating one requires a vapor-pressure relationship and a model for the actual surface. Its purpose is to show why averaging first and applying a strongly nonlinear process afterward can give a misleading answer.

Now give the patches identical temperatures but different water-delivery histories. One may be empty and the other contain frost. Thermal suitability describes storage potential. It does not establish whether the supply ever arrived or remained undisturbed.

Water elsewhere does not erase the polar story

NASA’s explanation of water detections distinguishes molecular water on sunlit terrain from earlier polar evidence. The phrase “water on the Moon” covers several forms, abundances, and environments, not lakes hidden just beyond every ridge.

LADEE-related research on meteoroid-released water shows that impacts can mobilize water into the thin lunar exosphere. Supply, migration, trapping, release, and loss form a cycle that is still being investigated.

That cycle complicates the idea of a single ancient delivery event. Different deposits may record different sources and histories. A cold-trap sample can therefore be valuable as an archive as well as a possible future resource.

As a map exercise, outline one permanently shaded region, then add a separate boundary for modeled water-ice stability. Do not force the outlines to match. Add a third layer for an actual compositional detection. Their overlap is more informative than any layer alone, and a blank region can mean missing coverage rather than a confirmed absence of ice.

One deliberate plume tested one dark place

LCROSS approached the lunar-water question through a brief physical intervention. In October 2009, a spent rocket stage struck the permanently shadowed region of Cabeus crater. The following spacecraft and other instruments observed material raised from a place difficult to inspect in ordinary sunlight.
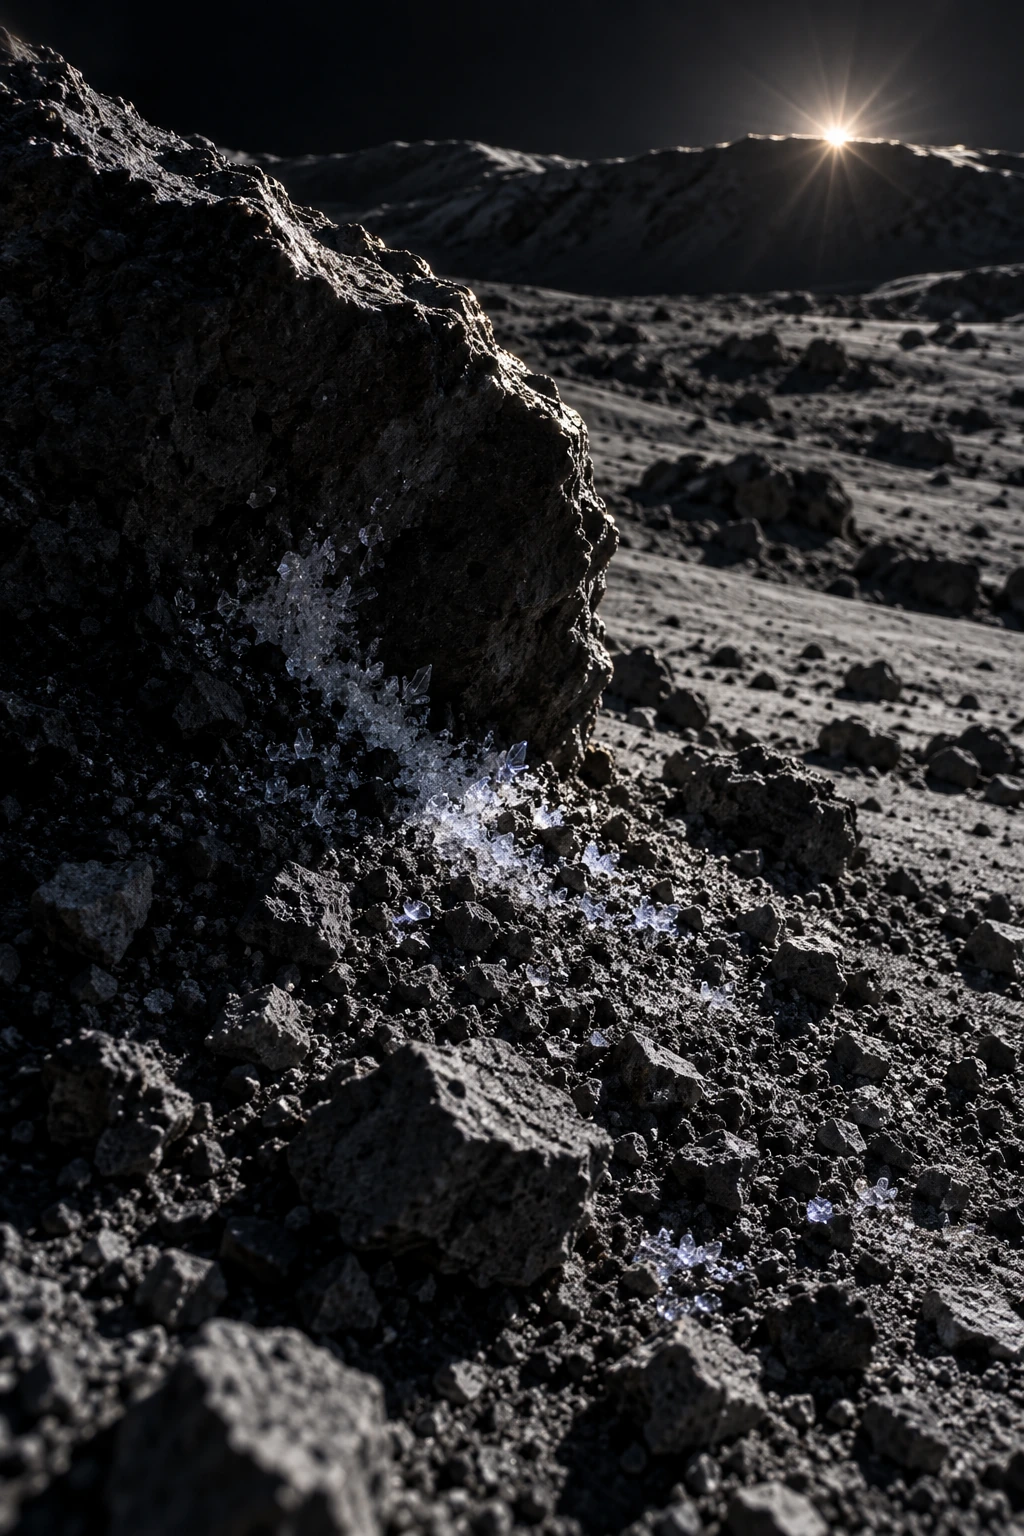
Sparse frost crystals protected beside rough lunar regolith in deep shadow
Conceptual cold-trap microterrain; it does not locate or estimate a lunar deposit.

NASA’s 2010 results account describes water and a mixture of other volatile-related signals in the ejecta. The composition was more varied than a simple block of pure water ice. A mission science report on volatile species follows the observations during the short interval between the first impact and the shepherding spacecraft’s own impact.

The measurement is powerful because material from the shadow was brought into an observable plume. Its interpretation still needs a model of what was excavated, what fraction entered the viewed material, how it changed during the event, and what the instruments could detect. Sampling through an impact is not the same thing as taking an undisturbed core from every depth.

Keep the footprint attached to the conclusion

Four different statements about Cabeus
StatementAdditional bridge needed
Water-related signals occurred in the plumeSpectral identification and instrument response
A concentration characterizes excavated materialExcavation and plume-mass model
The concentration applies across the craterSpatial sampling and geological context
The material is an accessible resourceDepth, distribution, terrain and extraction evidence

For a reader exercise, start with the first row and draw only the arrows the mission observation directly helps constrain. Then circle the rows that require a broader spatial claim. A positive detection at one site is not automatically a survey of every dark floor at the lunar pole.

Now imagine two fictional deposits with the same total water mass. In one, a thin enriched layer lies near the surface; in the other, a much larger volume contains very dilute water at depth. The same total mass says little about how the deposits would be sampled or used. Distribution matters as much as a headline inventory.

Return to the thermal maps. A cold-trap model asks whether a volatile could persist; a plume spectrum asks about material actually encountered. The two strengthen one another when their locations, depths, and physical assumptions line up. Neither should quietly replace the other.

The small frost study above is therefore an invitation to imagine protected microterrain, not a map of the LCROSS deposit. The observation’s real drama is stronger: one carefully watched plume connected an otherwise inaccessible shadow with measurable chemistry, while leaving a larger landscape still to investigate.

Read a polar map before imagining a mine

Identify whether a map shows illumination, maximum temperature, hydrogen, inferred surface ice, or a modeled stability zone. Then check its resolution and date. A small bright pixel and a large potential cold area are not equivalent resource estimates.

Actual accessibility also depends on terrain, deposit concentration, depth, mechanical properties, and operating temperatures. The presence of water-related evidence is not enough to establish that extraction is straightforward or that every shadowed crater has the same material.

The most useful image to carry away is a rough landscape under grazing light. Its shadows are a patchwork of different thermal histories. Somewhere within that patchwork, molecules can linger long enough to become a record of how water reaches and leaves an airless world.

Sources and a next step

Continue exploring art, ideas, and unexpected connections at Incoprea.

Wednesday, October 14, 2026

Lunar Mascons: The Heavy Patches Hidden Under the Moon

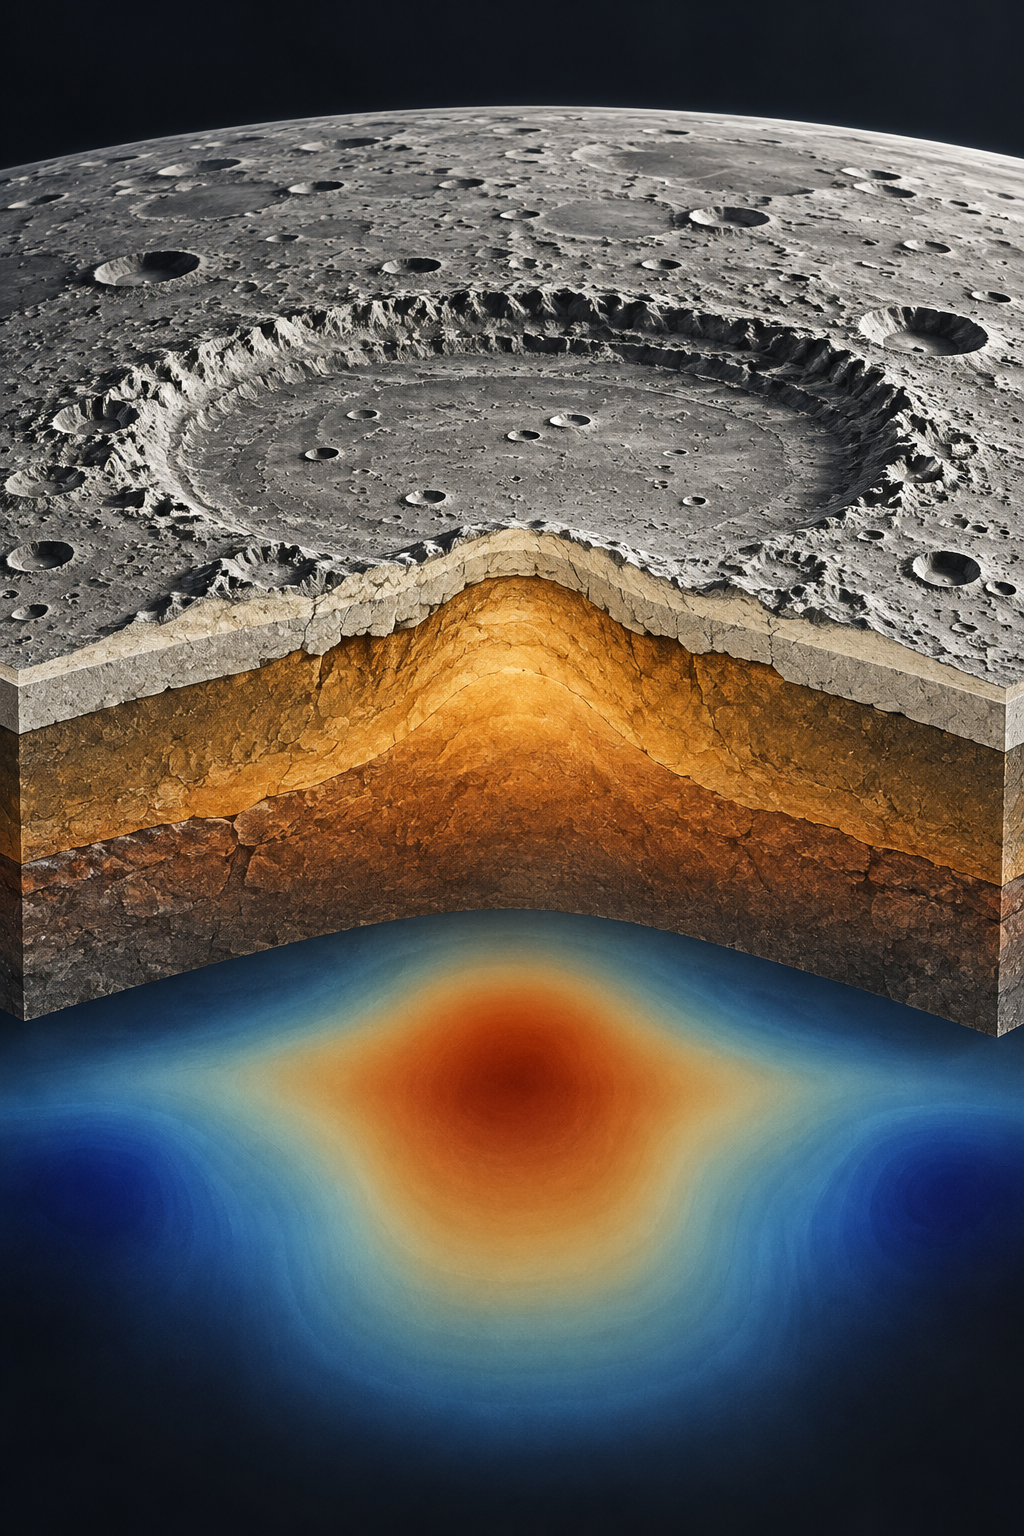
An interpretive lunar basin cutaway shows denser rock uplifted beneath a crater and an abstract gravity halo.
Conceptual illustration of a lunar mascon. Rock colors, layers and gravity shading are simplified; this is not a GRAIL data map.

The Moon looks solid and still, but its gravity is not perfectly smooth. A spacecraft passing over one region can be pulled a little more strongly than over another. Some of the strongest patches lie beneath enormous ancient impact basins. They are called mascons, short for mass concentrations.

A mascon is not a hidden ball of exotic metal. It is an excess of mass compared with what a simple reference model would predict, produced by the arrangement and density of lunar rock. These invisible differences matter to spacecraft navigation and preserve clues to a violent geological past.

Reading gravity with two spacecraft

NASA's GRAIL mission used two spacecraft, Ebb and Flow, following one another around the Moon. Instruments measured tiny changes in the distance between them. When the leading spacecraft encountered a stronger gravitational pull, it moved slightly differently from its companion. As the second followed, the separation changed again.

Combining these measurements across many orbits produced exceptionally detailed gravity maps. Such maps do not show the same thing as photographs. A striking surface crater and a strong gravity anomaly can correspond, but gravity also responds to material below the visible ground.

Colors on a gravity map encode departures from a chosen reference. They do not mean the lunar surface is physically red or blue. Nor does a red patch mean gravity there rivals Earth's: the Moon's overall gravity remains much weaker.

Read the changing gap, rather than an imaginary weighing scale

Picture Ebb approaching a region with a mass surplus while Flow is still farther away. The same region does not pull on both spacecraft in exactly the same way at exactly the same instant. As they move onward, the geometry changes. The measurement is therefore a changing separation along a moving pair of trajectories, rather than a direct photograph of a buried rock.

A useful thought experiment is to replace the Moon with a perfectly smooth reference world. Predictable orbital motion would still change where the spacecraft were, but the departures associated with real structure would be absent. Scientists compare observations with models to recover the extra information. A gravity anomaly is a difference relative to that calculation; it is not a separate kind of gravity.

On the published map, choose a basin and inspect both its center and its surroundings. Read the legend before interpreting the colors. Are you looking at a surplus, a deficit or a transition between them? The surrounding rings matter because an impact rearranges material across a region. Reducing the result to one heavy dot throws away part of the geological evidence.

An impact leaves more than a hole

Large impacts excavated crust, deformed the interior and brought denser mantle material upward beneath their basins. The resulting structure then cooled and evolved. In some basins, later volcanic lava added additional dense material. Together, these processes can leave a mass surplus that a passing spacecraft detects.

GRAIL data and computer models helped researchers explain the characteristic gravity patterns around major basins. Some have a central positive anomaly surrounded by rings with different gravitational signatures. The details depend on the impact, the thickness and properties of the crust, and subsequent geological history.

Why a gravity map does not uniquely name a rock

Imagine two sealed boxes of the same size. One holds a compact dense object near the top; another contains a different arrangement of material spread through its interior. A measurement of their external pull gives information about mass, but a limited set of measurements need not reveal every detail of either box. The analogy helps explain why researchers combine gravity with other evidence.

For lunar basins, topography constrains the visible shape. Knowledge of crustal thickness and plausible rock densities constrains possible interior arrangements. Impact simulations test whether a proposed sequence could produce the observed pattern. A successful explanation has to fit these different requirements together, rather than fitting a colored patch alone.

The distinction also clarifies the role of lava. A dark volcanic plain can add dense material to a basin, yet the broader mascon explanation includes excavation, deformation and cooling. “The crater filled with lava” is too small a story for every observed pattern. The buried geometry and the material's history both matter.

Try stating what each illustration contributes in one sentence. The cutaway proposes a way to imagine the interior. The gravity map represents a measured field after mathematical processing. The surface photograph records reflected light from terrain. None replaces the others. Their combination turns spacecraft navigation data into a reconstruction of an event that no observer could have watched when it happened.

A practical map of an uneven world

For mission planners, an uneven gravitational field means an orbit must be calculated with more care than if the Moon were a perfectly uniform sphere. The same precision can turn an old navigation difficulty into a powerful scientific tool. Changing spacecraft motion is a measurement of the world beneath it.

Compare the cutaway with NASA's actual GRAIL gravity map, using its legend to identify the measured quantity.

Sources and further reading: NASA/JPL: GRAIL solves the mascon mystery · NASA: GRAIL gravity map · NASA Gravity Assist: The Moon’s Holy GRAIL

The Moon Keeps One Face Toward Us—Yet We See Around Its Edges

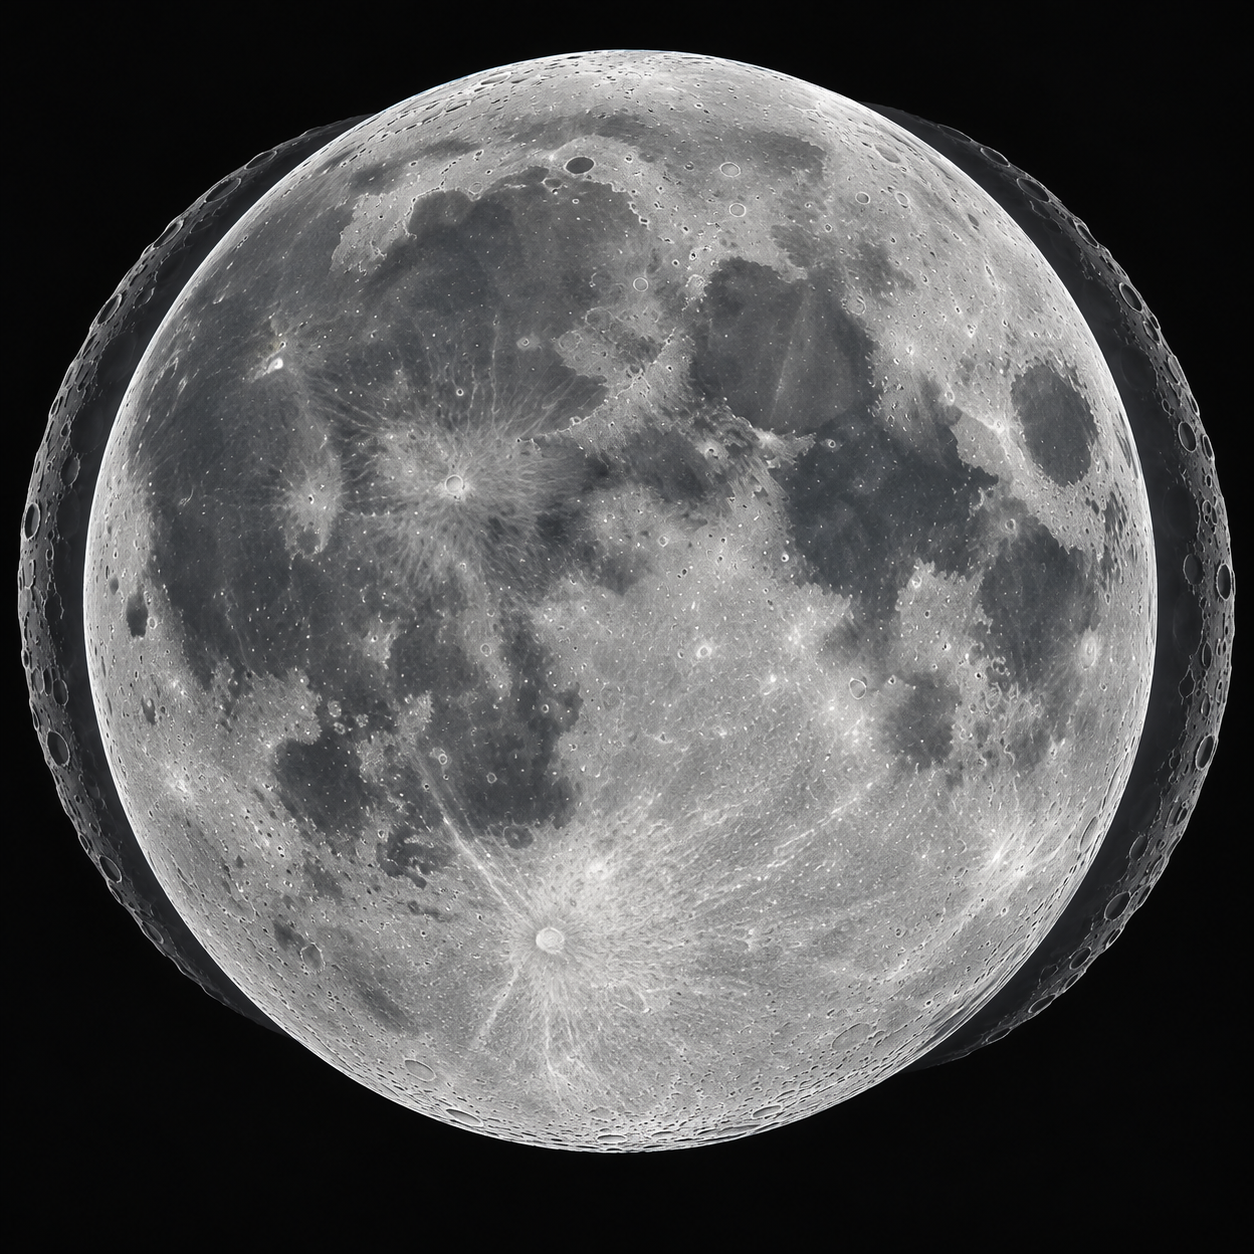
An illustrated near-side Moon has faint offset outlines around its rim to suggest a changing viewpoint.
Conceptual illustration of lunar libration. The ghosted rims suggest changing views; they are not measured lunar outlines.

Put a month's Moon images into a fast animation and something surprising happens. The familiar face seems to rock, nod and turn. Dark plains shift slightly toward the edge, and craters near the rim alternately become easier and harder to see. The Moon still keeps broadly the same hemisphere facing Earth. Our changing view is called libration.

This is why observers can eventually see about 59 percent of the lunar surface, rather than precisely half. That extra area is revealed gradually around the edges. It is not all visible at once, and most of the far side remains beyond an Earthbound observer's view.

A steady spin and an uneven journey

The Moon rotates once on its axis in approximately the same time that it completes an orbit around Earth. This synchronous rotation is the reason it presents one familiar face. It does rotate: a Moon that did not turn as it orbited would show us every side.

But its orbit is elliptical, so its orbital motion speeds up and slows down. Its rotation is much more uniform. For part of an orbit, the orbital movement runs slightly ahead of the rotation; during another part, it falls slightly behind. From Earth, this mismatch lets us peek a little around the eastern and western limbs. This effect is libration in longitude.

The chair exercise that settles the rotation question

Place a chair in the center of a clear space and walk slowly around it while keeping your face toward the chair. By the time you return to your starting point, you have turned once relative to the room. Keeping one face inward requires rotation. Now repeat only a small part of the walk while keeping your face toward the same wall. Your side begins to face the chair instead.

The exercise is a model of orientation, not a scale model of gravity or speed. It is useful because “always facing Earth” can sound like the absence of turning when it actually describes a relationship between two motions. The Moon's synchronized spin does not mean that it stands still relative to distant stars.

To imagine longitude libration, let your walking pace vary while your turning remains steadier. You cannot reproduce the full celestial geometry perfectly by walking, but you can feel the mismatch. A little extra orbital progress changes which edge of your face points inward. The important ingredient is the difference between orbital angle and rotation angle, not an unexplained monthly shaking.

Looking over the poles

A second ingredient is tilt. The Moon's rotational axis is inclined relative to its orbital plane. As it travels, our viewpoint alternates between looking slightly over the north pole and slightly under the south pole. This is libration in latitude.

Earth itself also matters. An observer on the turning Earth's surface changes position relative to the Moon between moonrise and moonset. This smaller perspective change contributes another kind of apparent libration. There are also small real variations in lunar rotation, called physical librations. The conspicuous monthly rocking seen in a time-lapse is primarily a result of viewing geometry, rather than a dramatic physical tumble.

These shifts should be distinguished from the lunar phases. A crescent or full Moon describes how much of the Earth-facing disk is illuminated by the Sun. Libration describes which terrain is presented to us. Two images with similar phases can show subtly different views of a feature near the rim.

Make three passes through the animation

On the first pass, watch only the boundary between lunar day and night. It sweeps across the terrain as the phase changes. Notice how long shadows emphasize craters close to that boundary. A feature becoming more dramatic under low sunlight does not necessarily mean that libration has brought it newly into view.

On the second pass, follow the center of one dark plain near the edge of the disk. Its position relative to the rim changes with viewing angle. Pause at two frames with broadly similar illumination and compare the amount of surrounding terrain visible. This is closer to the question of libration than comparing a narrow crescent with a full Moon.

On the third pass, watch the disk's size without following individual markings. NASA includes the changing Earth–Moon distance in the visualization. Growing larger and peeking around an edge can occur together, yet one is a distance effect and the other an orientation effect. Separating them makes the apparent motion much easier to read.

For your own photographs, note the date, time and image orientation. A telescope, camera or viewing program can rotate or mirror a picture, which complicates a comparison based on “left” and “right.” NASA's linked page labels its orientation and uses a geocentric view. Your position on Earth's surface adds another perspective difference, so matching two pictures requires more care than matching their apparent phase.

Watch the same crater move

The Moon also appears larger when it is closer to Earth and smaller when farther away. That changing size adds another movement to the animation, but it does not explain the sideways peek. The useful habit is to separate illumination, distance and viewing angle: three different causes can change the appearance of the same familiar world.

NASA Scientific Visualization Studio: simulated Moon phase and libration for 2026, built with lunar terrain data. Explore the interactive view and full credits.

Sources and further reading: NASA: What is lunar libration? · NASA: Moon Wobble · NASA: Moon Phase and Libration, 2026

Famous Last Meals is now in paperback — stories, history and 25 recipes

Famous Last Meals: Stories, History, and Recipes is now available in paperback on Amazon. The illustrated collection brings together 23 his...