Showing posts with label Deep Time. Show all posts

Thursday, October 22, 2026

Zircon Clocks: A Tiny Crystal Can Keep More Than One Geological Date

A zircon grain can be smaller than a pinhead and older than the rock now carrying it. It may have crystallized in one geological episode, survived erosion, entered a sediment, and acquired a younger rim during later heating. Calling it a tiny clock is useful, provided the clock is allowed to have a history.

Uranium-lead geochronology measures isotopic ratios and interprets them in that history. The result is not simply “the age of the stone.” A good question asks which event, in which part of the grain, a particular date represents.
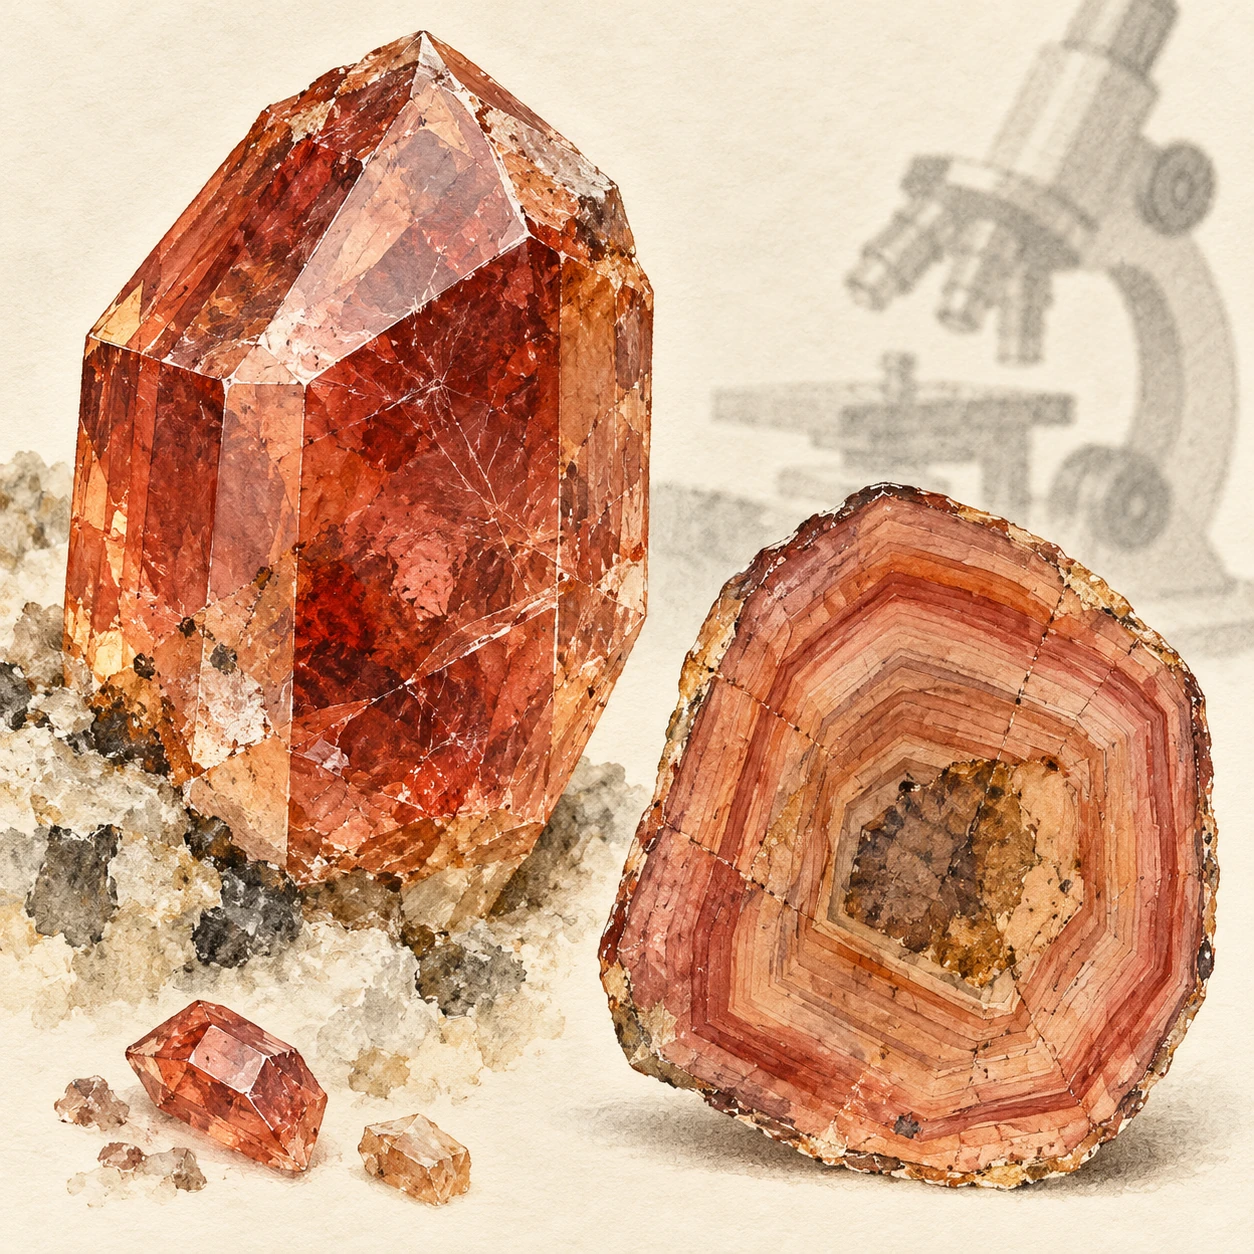
Enlarged watercolor zircon crystal beside a conceptual polished section showing an older core and younger growth zones.
Mineral study and conceptual growth-zone section. It is not a microscope image, isotope map, or dated specimen.

Why zircon keeps appearing in geological timelines

Zircon’s crystal structure can incorporate uranium while generally incorporating little lead when it grows. Radioactive uranium then produces lead through known decay chains. The mineral is also resistant enough to survive many later geological processes.

The American Museum of Natural History’s zircon chronology guide explains how the mineral records multiple episodes. Its durability is both an advantage and a complication: an inherited grain can preserve an older event inside a younger host.

That is why a very old zircon in sandstone does not make the sandstone equally old. The sand grain had to exist before it was deposited. Its crystallization age can constrain the sediment’s history, but it is not automatically the deposition age.

Two related isotope clocks

Two uranium decay systems are especially useful: uranium-238 to lead-206 and uranium-235 to lead-207. Their different decay constants provide related age estimates that can be compared. Under an ideal closed-system history, the ratios agree on an age.

UCL’s geochronology teaching chapter introduces the concordia diagram, whose curve represents agreement between these systems over time. A measured point is accompanied by uncertainty, often shown as an ellipse. The visual test is more careful than deciding whether a dot looks close to a line.

“Closed system” means the relevant parents and daughters have been retained in the way assumed by the model. It is a testable geological and analytical proposition, not permission to ignore alteration, lead loss, or non-radiogenic lead.

When a grain does not tell one date

A zircon can contain an old core and younger growth zones. Measuring across both may mix information. Imaging the polished grain helps researchers choose analysis locations and connect isotope measurements with visible textures.

Yellowstone Science’s discussion of zircon dating illustrates how age measurements fit geological questions and how populations of detrital grains can help trace sediment sources. The analysis is strongest when the grain’s context survives the journey from field sample to published plot.

Lead loss can move a result away from concordia. In suitable cases, a set of discordant analyses can help constrain an older formation event and a later disturbance. But a fitted line is not a universal decoder for every complex history. More than one episode, mixed zones, or unsuitable assumptions can make a simple interpretation misleading.

A three-age thought experiment

Imagine a hypothetical crystal core formed 1,500 million years ago. It erodes into sediment deposited 500 million years ago, then grows a metamorphic rim 200 million years ago. A core analysis and a rim analysis can both be valid while giving very different dates.

Now ask four questions. When did the core crystallize? When was the sediment deposited? When did metamorphism affect it? When was the present outcrop exposed? The two zircon analyses directly address only some of those questions. Other observations and methods must fill the gaps.

These invented ages are not a real sample. They show why “the dates disagree” is often the wrong first conclusion. Different measurements may have successfully dated different events.

The instrument’s scale changes the question

Spatially resolved methods can target small zones, while dissolving selected material for isotope-dilution analysis can offer a different precision and averaging strategy. Each approach trades spatial information, analytical uncertainty, sample preparation, and potential sources of bias differently.

The London Geochronology Centre lists several isotope systems and analytical capabilities. Seeing multiple methods together helps dispel the idea of one universal rock-age machine. Laboratories choose techniques to match the material and event of interest.

A date with small analytical error can still be interpreted incorrectly. Precision describes the measurement’s spread under its analytical framework. Geological accuracy also depends on identifying the event, screening disturbance, and accounting for shared systematic uncertainties.

For one more check, put the core and rim dates on a timeline together with the host rock’s mapped relationships. An older grain enclosed in a younger deposit is geometrically possible; a proposed event sequence that places deposition before its supposed source crystal formed needs reconsideration. The exercise is not an independent date, but it tests whether the interpretation respects the order implied by the evidence. Numbers become more informative when their geological verbs—grew, eroded, settled, reheated—are written beside them.

Sometimes the preparation is part of the question

A zircon’s resistance does not make it indestructible. Radioactive decay can damage its crystal structure, and damaged domains can be more susceptible to losing lead. A measured ratio then reflects both production and subsequent history. Before interpreting an unexpectedly young date as a young growth event, a laboratory has to investigate whether the system remained closed.
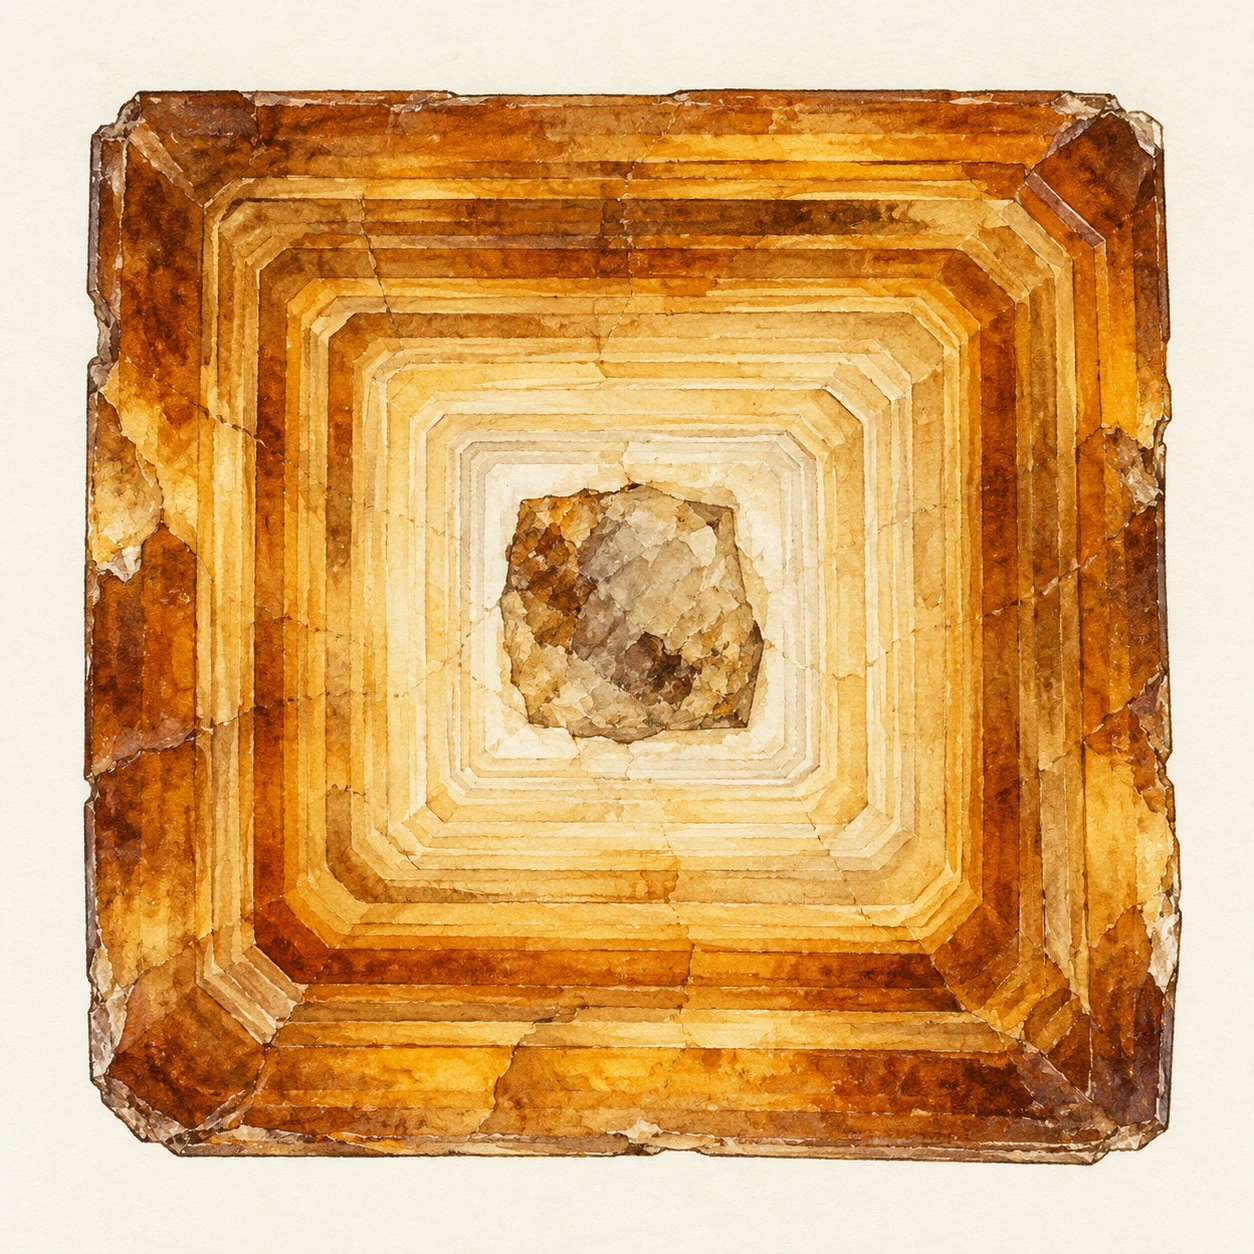
An enlarged square zircon cross section with angular growth zones around an irregular core
Conceptual tetragonal mineral-zoning section, enlarged and interpretive; no dates or microscope measurements are shown.

In a Caetano caldera study by Watts and colleagues, unexpectedly young SIMS dates motivated a comparison of chemically abraded and untreated zircon. Chemical abrasion is a preparation approach intended to remove susceptible material. This is not a way to make every grain give the desired age; it is an intervention whose effects must be documented and tested.

A 2026 paired-method study of detrital zircon illustrates a related strategy. After screening sandstone grains with laser-ablation measurements, researchers selected some apparently youngest grains for more precise follow-up by chemical-abrasion isotope-dilution thermal-ionization mass spectrometry. The same geological question can require a broad survey and a smaller, more detailed investigation.

Which grain would you investigate next?

Suppose an invented sandstone dataset contains most grain dates near 150 million years, a small cluster near 120 million, and one at 90 million. The lone youngest analysis could matter enormously for an attempted maximum depositional age. It could also be the result that most needs checking.

Choose between three next steps: repeat a measurement in the same zone, image the grain and target another zone, or apply a preparation and analysis method that tests a lead-loss explanation. There is no universal winner. Your choice depends on whether the first measurement’s spatial context, uncertainty, and disturbance behavior are already known.

Write what each step could resolve. A repeated spot can test reproducibility without eliminating a shared bias. Imaging can reveal growth or alteration textures without independently dating them. A different preparation and analytical approach can test a mechanism, while changing what portion of the grain survives to be measured.

Does the youngest number automatically date deposition?

No. A reliable youngest detrital crystallization date can provide a maximum-age constraint: the sediment must have been deposited after that grain formed. It may have been deposited much later. Disturbance can produce misleadingly young apparent dates, and a youngest population needs a geological as well as statistical interpretation.

Now change the example so that the 90-million-year result is a well-characterized younger rim instead of an unexplained spot. You have changed the event being dated, not merely improved the decimal places. The preparation, zone, and geological verb belong beside the number.

This view makes laboratory work less mysterious. An instrument does not deliver a historical verdict on its own. Investigators choose which material to preserve, which potential disturbance to test, and which independent relationships make the resulting interpretation credible.

Read an age table as a chain of evidence

  1. Find the sample’s rock type and field relationship.
  2. Check whether the analysis targeted a core, rim, or whole grain.
  3. Read which isotope ratio and correction method produced the date.
  4. Look for discordance criteria, uncertainty conventions, and excluded analyses.
  5. Compare the interpreted event with independent geological constraints.

This guide is for reading published work, not selecting favorable points until a desired age appears. Exclusions need a stated rationale, and uncertainty should be carried into the geological conclusion.

A USGS zircon and monazite report from Vermont offers an example of a documented multi-sample study. Rather than starting with its oldest number, inspect how samples, analyses, and interpretation are connected. The supporting table is part of the result.

The crystal is an archive, not a verdict

A dramatic “oldest material” headline can be an entry point, but the richer story is how a mineral preserves and sometimes edits evidence. Growth, transport, heating, damage, and measurement each leave their mark.

The reader gains more by following one grain’s sequence than by collecting superlative ages. Inside that small crystal, geological time is not a single label. It is a set of events that careful analysis can begin to separate.

Sources and a next step

Continue exploring art, ideas, and unexpected connections at Incoprea.

Cosmogenic Nuclides: Reading How Long a Rock Has Faced the Sky

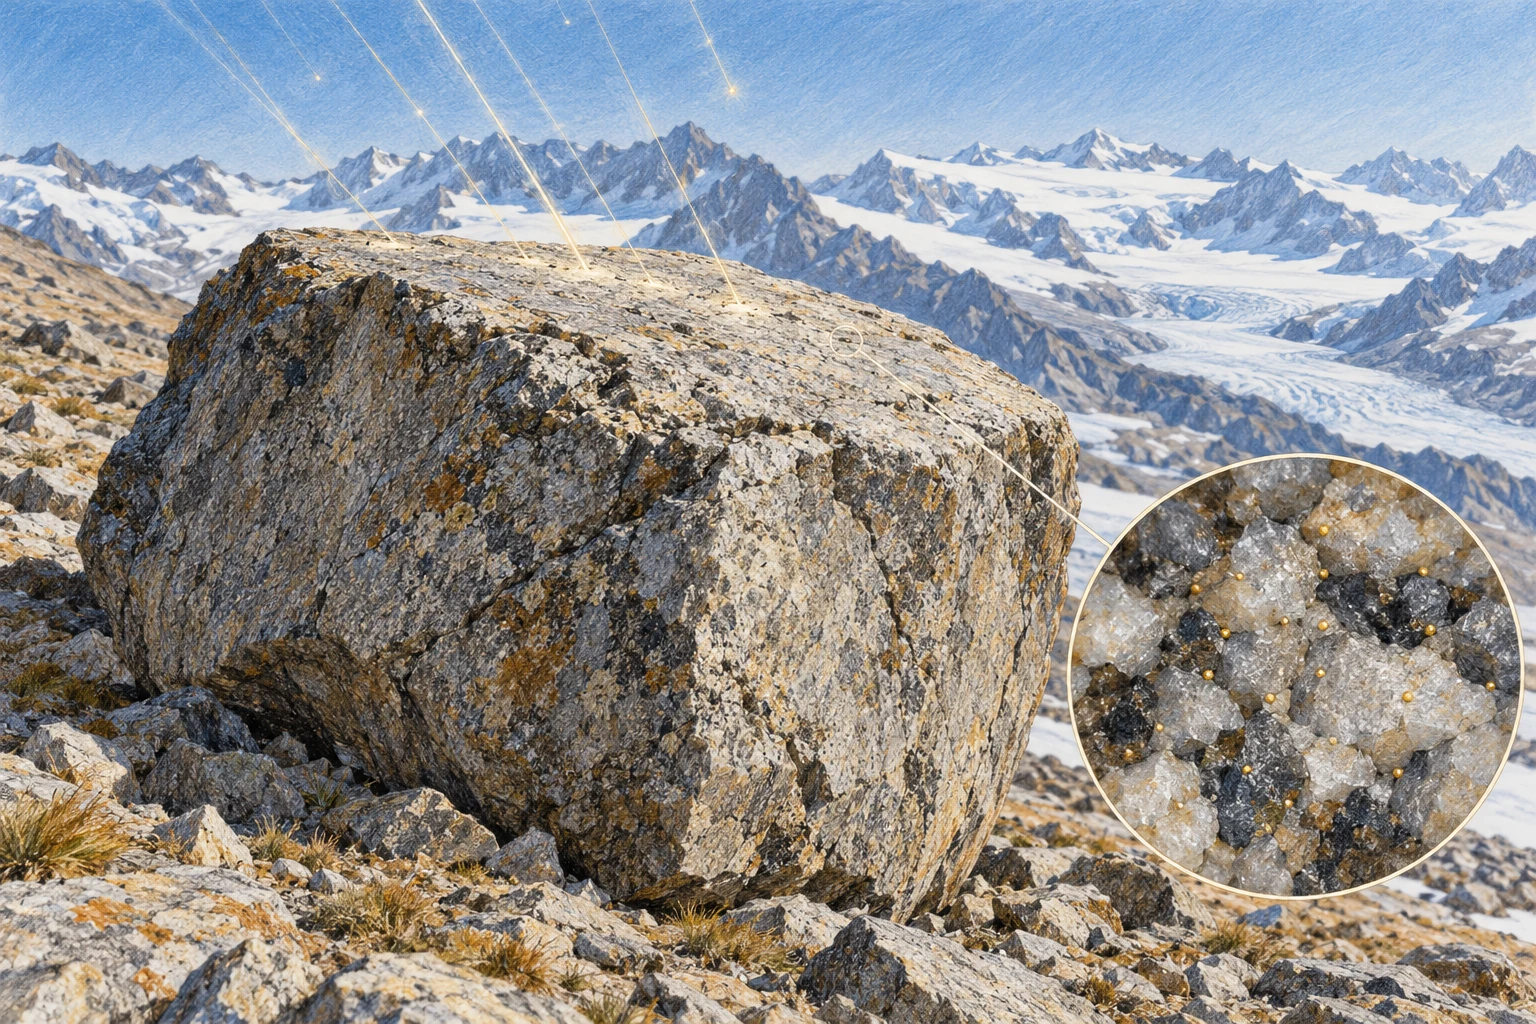
Colored-pencil alpine moraine boulder with faint conceptual particle tracks and a magnified surface-crystal detail.
Conceptual artwork of cosmogenic exposure. Particle tracks and isotope dots are visual metaphors, not visible features or measured data.

A glacier leaves a boulder on a ridge and retreats. The boulder’s exposed surface begins accumulating rare isotopes made by cosmic-ray interactions. Much later, a small rock sample can help estimate how long that surface has faced the sky.

Cosmogenic exposure dating is not the age of the boulder’s original rock. It is an interpretation of its near-surface history. A granite block can be hundreds of millions of years old while its present exposed face records only the most recent part of that story.

Space makes a small inventory in stone

High-energy cosmic particles generate secondary particles in the atmosphere and near-surface material. Nuclear interactions produce rare nuclides in minerals. Commonly used examples include beryllium-10 and aluminum-26 in quartz, though several other systems are available.

A USGS review of cosmogenic dating explains how measured concentrations, production rates, and decay behavior become tools for dating landforms and estimating erosion. The production is small, requiring sensitive chemical preparation and measurement.

The signal is strongest near the surface and changes with depth. It also depends on altitude, geomagnetic conditions, shielding, and the target mineral. A universal “atoms per year” value cannot be pasted onto every rock on Earth.

The simplest clock is a useful first model

If a stable nuclide accumulates at a constant rate P, begins with no inherited inventory, and is neither eroded nor shielded, its concentration N grows asP multiplied by time. Dividing N by P gives the exposure duration in that deliberately simple model.

For a radioactive nuclide, decay must also be included, and production and erosion can change. The point of the simple model is to expose the assumptions. Each term omitted from it becomes a possible reason the apparent exposure age differs from the landform event.

National Park Service research in the western Alaska Range connects the method with glacial deposits. A moraine’s chronology depends on selecting surfaces whose exposure is plausibly tied to the glacier’s retreat or the deposit’s stabilization.

Three ways the surface history can mislead

Inheritance: a rock already exposed before deposition can carry nuclides into its new setting. Interpreting the full inventory as newly accumulated can produce an apparent age older than the intended event.

Shielding: snow, sediment, water, surrounding topography, or temporary burial can reduce production. Treating an intermittently covered surface as continuously open can make the inferred duration too short.

Erosion or rotation: removing the nuclide-rich outer layer or turning a different face upward can reset part of the observable history. The rock is not a sealed counter that always keeps every event.

USGS work on Yosemite rock-fall deposits explicitly discusses inheritance, erosion, boulder rotation, fire-related spalling, and shielding. The complications are not objections discovered after the method was invented; they are central parts of sampling and interpretation.

A numerical thought experiment

Imagine a hypothetical nuclide produced at 10 atoms per gram per year under fixed conditions, with decay ignored over the example’s timescale. A concentration of 100,000 atoms per gram would imply 10,000 years in the simplest model.

If 20,000 atoms per gram were inherited before the target event, only 80,000 belong to the new exposure, implying 8,000 years under the same assumptions. If shielding reduced production during part of the history, a different correction would be needed. The same measured number can support different durations when the history changes.

These invented values illustrate the accounting, not the actual production rate for a specified mineral, latitude, or altitude. A real calculation uses calibrated scaling and propagates uncertainty rather than choosing round numbers.

Why field photographs matter to a laboratory date

Researchers record the boulder’s setting, stability, surface shape, sample thickness, surrounding horizon, and evidence for erosion or burial. A large stable top surface may be preferable to a loose edge that could have rotated recently.

A Yosemite account of investigating the El Capitan rock avalanche shows how carefully chosen boulders link a landscape question with laboratory analysis. The field interpretation determines what event the measurement can plausibly date.

An accelerator mass spectrometer can count a rare isotope with remarkable sensitivity. It cannot reconstruct an unrecorded snowbank or a boulder’s unnoticed overturning by itself. Better instruments do not make geological context optional.

Consider two neighbors on the same ridge: a stable boulder and one that overturned recently. Their underlying rock can have the same formation age, while their upward-facing surfaces carry very different recent exposure histories. Photographing only their present positions does not reveal the overturning date. Look instead for physical evidence of stability, weathering contrasts, and the relationship with surrounding sediment. This thought experiment shows why several samples from a landform are valuable without assuming that their mean must be the correct answer. Replication helps test a geological story; it does not remove the need to choose that story carefully.

More than one nuclide can reveal burial

Different nuclides have different production relationships and decay behavior. Measuring more than one can constrain exposure and burial histories that a single concentration leaves ambiguous. This is especially valuable when material has alternated between surface and shielded conditions.

Lamont-Doherty’s cosmogenic laboratory guide outlines several systems and applications. Its broader program shows that the same physical process can address glacier history, landscape erosion, and sediment transport, provided the model matches the question.

A buried surface can keep losing two clocks at different rates

The paired-nuclide idea becomes easier to grasp with a period when production nearly stops. If a previously exposed surface is deeply buried, radioactive nuclides already present continue to decay. A faster-decaying nuclide loses a larger fraction of its inventory than a slower one. Their ratio can therefore preserve information about the burial interval.

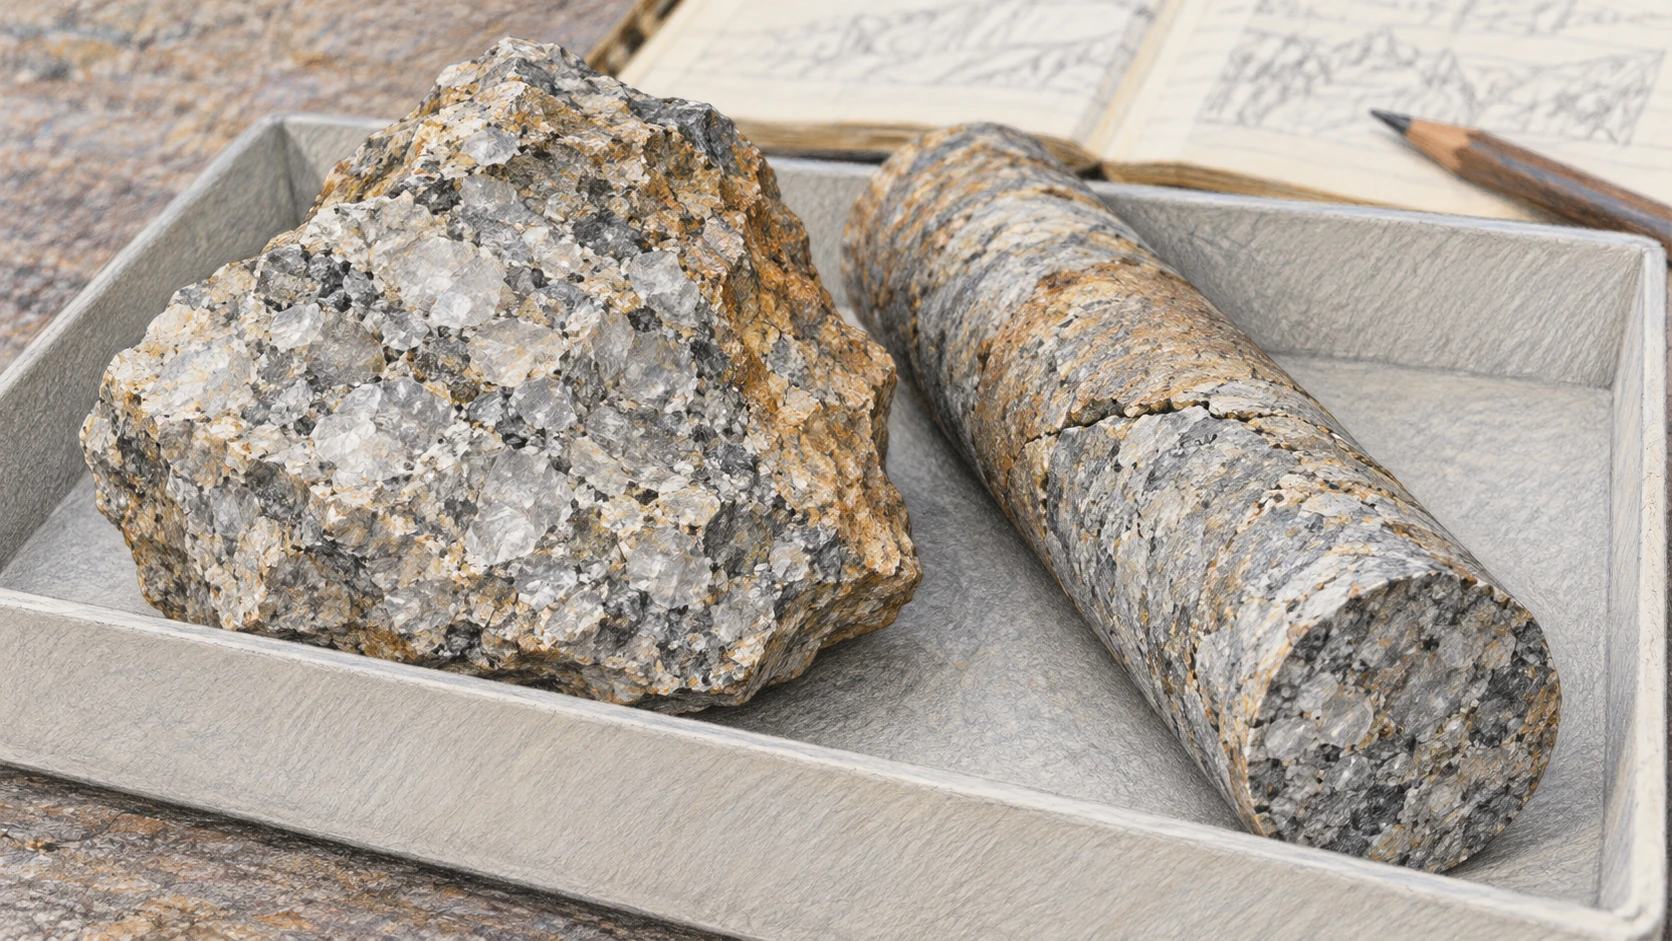
Quartz-rich rock and a slender bedrock core in a plain sample tray
Material study; these are not dated samples from Greenland or Salida.

The GreenDrill project’s explanation applies multiple nuclides to bedrock beneath Greenland’s ice. A rock currently hidden from the sky can retain evidence of an earlier exposure. The interpretation combines the inventory with production, shielding, erosion, and the ice-sheet history rather than treating burial as a perfect universal off switch.

A USGS data release for alluvial deposits near Salida offers a different real application. It separates aluminum-26 and beryllium-10 measurements from location information and interpreted burial-age results. The documented revision of the sampled unit’s geological identification is especially instructive: a laboratory result needs an accurate account of what deposit was sampled.

Let two invented nuclides decay

In this model, nuclide A has a half-life of one arbitrary time unit and B has a half-life of two. Both begin at an inventory of 100, with no new production and no loss except radioactive decay. After two units, A is 25 and B is 50. The A/B ratio has changed from 1 to 0.5.

Two invented burial clocks

Compare unequal half-lives and the importance of the initial ratio.

Open this activity in its own window.

Move the burial-duration control and predict which curve falls faster. Then double both initial inventories. Their absolute values change, but their ratio history is identical. Now change only the initial A/B ratio: the final ratio no longer provides a unique duration unless that initial relationship is known or constrained.

The arbitrary half-lives deliberately avoid masquerading as an exposure-age calculator for real isotopes. Real burial dating may include inherited inventories, continued production at depth, erosion, mixtures, and multiple exposure episodes. A clean curve here demonstrates only the mathematical effect of different decay rates.

For a final notebook exercise, draw three stages labeled exposed, buried, and exposed again. Mark production as high, low, or resumed, and leave the exact values unspecified. Ask which parts of that history a single final concentration cannot distinguish. Add a second nuclide and decide what extra constraint it provides.

The surprising archive is not only a surface that faced the sky. It is a surface whose subsequent absence from the sky changed the relationship between the clues it already carried.

Read the age population before the headline

If several boulders on one moraine yield different apparent ages, do not immediately average them into one confident date. Ask whether the scatter reflects measurement uncertainty, inherited exposure, delayed stabilization, erosion, or more than one landform episode.

A useful paper exercise is to draw five boulders and assign each a different complication. Decide what extra field evidence would help distinguish it. The goal is not to reject inconvenient data, but to make the geological explanation testable.

The exposure clock is remarkable because it reads a surface’s relationship with the sky. Its strongest results come from combining an extremely small isotope inventory with an unusually careful history of an ordinary-looking rock.

Sources and a next step

Continue exploring art, ideas, and unexpected connections at Incoprea.
The Laschamp Excursion: A Brief Detour in Earth’s Magnetic Field

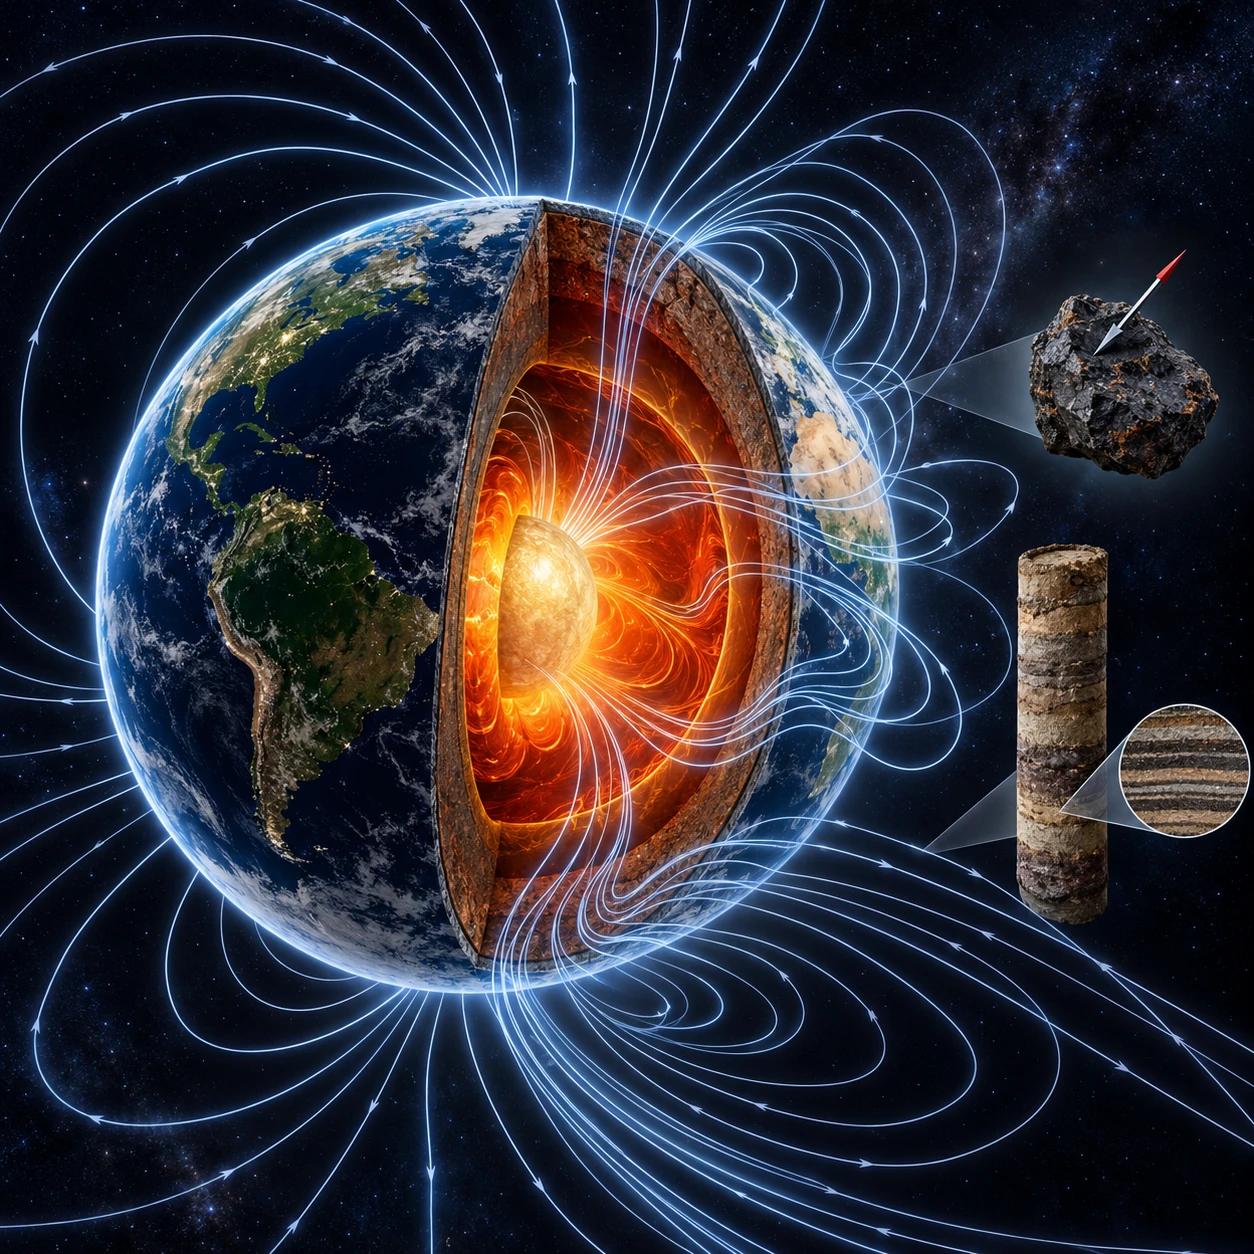
Conceptual Earth cutaway with asymmetric pale magnetic field lines, an oriented lava sample, and a layered sediment core.
Conceptual paleomagnetic artwork, not a reconstruction of the Laschamp field. Field lines, colors, and sample scales are illustrative.

About 41,000 years ago, Earth’s magnetic field made a brief departure from its usual configuration. The field weakened strongly and directions changed dramatically before returning to the preceding polarity. The event is known as the Laschamp excursion.

The planet did not turn upside down. Geographic north, Earth’s rotation axis, and the magnetic direction recorded by a rock are different things. The interesting story is how researchers reconstruct a changing invisible field from materials that recorded it in different ways.

A magnetic event, recorded indirectly

Cooling lava can preserve a remanent magnetization related to the field at the time it acquired that record. Sediments can also retain magnetic information, though deposition, alignment, compaction, chemical changes, and later disturbance complicate the recording process.

The USGS polarity-reversal guide explains the geological evidence for reversals and excursions. An excursion returns to the preceding polarity rather than establishing a long new polarity interval. The boundary between named categories is a description of the reconstructed behavior, not a physical switch labeled “excursion.”

Laschamp is especially useful because evidence appears in multiple archives and regions. A striking lava direction at one locality alone could be questioned as a local or recording effect. Agreement among independently studied records strengthens the case for a global field change.

Time resolution changes the apparent event

A lava flow may record a relatively limited interval of cooling. A sediment core offers a more continuous sequence, but the signal can be smoothed or shifted by the way magnetization becomes locked in. An ice core records other consequences through different physical and chemical processes.

A high-resolution marine-sediment study from the Blake-Bahama Outer Ridge discusses how archive properties affect reconstructed duration and direction. The event does not come with one universally visible start and end that every material records identically.

This is why it is better to report an approximate age here than to assign a single exact calendar year. Dating uncertainty, archive response, and the chosen definition of the excursion all contribute to the comparison.

Weakening the shield changes another archive

Earth’s magnetic field influences the access of charged cosmic particles to the atmosphere. Changes can affect production of cosmogenic isotopes such as beryllium-10 and radiocarbon. Those records offer evidence related to field intensity, while atmospheric transport and geochemical storage add their own filters.

Research using the EPICA Dome C ice core investigates a signal associated with the Laschamp interval and compares different kinds of evidence. A coincidence in two time series is useful, but its interpretation still depends on the processes linking each measurement to the field.

Field weakening is not identical to the field vanishing everywhere. Local directions and intensities can become complex when the global dipole contribution is reduced. A tidy bar-magnet drawing is least reliable precisely when the non-dipole structure becomes relatively important.

From scattered records to a global model

GFZ’s LSMOD models cover the interval around Laschamp and another excursion. They combine geographically distributed paleomagnetic information into a representation of field evolution, rather than simply joining a few magnetic poles on a map.

GFZ’s longer GGFSS 70 model provides another reconstruction covering several excursions. Differences in temporal smoothing, data coverage, and model choices can affect the details. A model animation is an interpretation constrained by observations, not footage of the ancient magnetic field.

Pay particular attention to regions with sparse data. A global globe must display something everywhere, but the observations do not constrain every place equally. Uncertainty should accompany the most dramatic-looking field-line pictures.

Three claims that require three evidence chains

Keep the inference ladder visible
ClaimEvidence needed
The field changed markedlyWell-dated magnetic records and coherent reconstruction
Atmospheric particle exposure changedField and production models plus cosmogenic archives
A specific ecological or human event resultedIndependent chronology, mechanism, magnitude, and alternatives

The first claim does not automatically prove the third. Broad stories about extinctions, human behavior, or climate require separate tests of timing and causality. A magnetic event can be well established while a proposed environmental consequence remains uncertain.

For a chronology exercise, draw three horizontal time axes for a lava sequence, a sediment core, and an ice core. Give each an uncertainty band instead of a perfectly sharp event line. Ask whether the bands overlap before deciding that two changes were simultaneous. Then allow one archive to smooth a short event into a broader feature. The exercise explains how a real shared signal can appear to have different durations, and how an apparently exact coincidence can weaken when dating uncertainty is restored.

Tree rings can sharpen a timeline without settling every consequence

A ring sequence supplies something different from a magnetic lava direction: a counted ordering within a tree’s life. Ancient New Zealand kauri wood has been used to reconstruct atmospheric radiocarbon variations across the Laschamp interval. That provides another way to compare the episode with records whose clocks have different uncertainties.

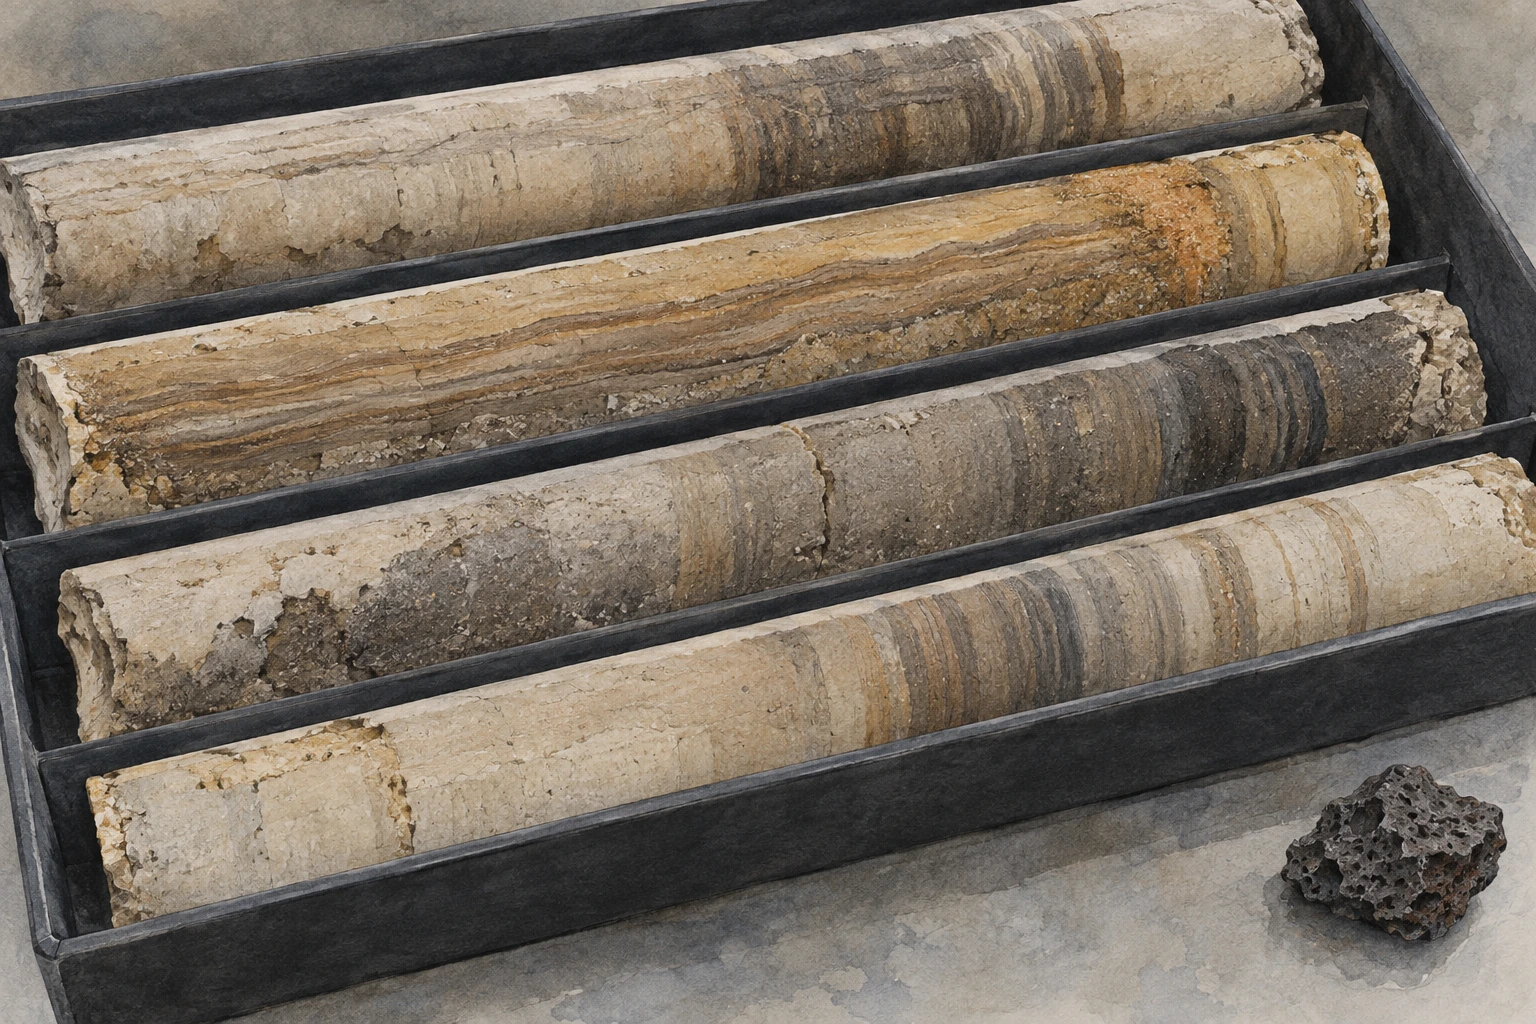
Layered sediment core halves beside a small dark volcanic sample
Archive-material illustration; the cores and rock are not actual Laschamp specimens.

Cooper and colleagues’ 2021 paper presented a detailed kauri-based radiocarbon record and proposed extensive environmental consequences. Its stronger causal story should be distinguished from the existence of the radiocarbon measurements themselves. Data can remain valuable while an interpretation of their broader significance is debated.

A published scientific comment on that paper challenged the proposed alignment with major climatic and human changes. Its authors argued that independent climate and archaeological records did not support the sweeping crisis account. This is a disagreement about chronology, mechanism, and consequence, not evidence that the magnetic excursion was invented.

Put three claims on separate cards

Card one says the magnetic field changed. Card two says cosmogenic production changed. Card three says a particular population disappeared because of those changes. Arrange the evidence needed beneath each. A single radiocarbon curve cannot do every job.

Now add a fictional dating uncertainty of several centuries to the population event. Place the magnetic change as an interval rather than a needle-thin line. Overlap makes a causal proposal possible to investigate; it does not identify the cause. Lack of overlap, if the dates are reliable, can rule out a simple ordering in which a later event caused an earlier one.

Next insert the missing physical chain. How would changed particle access alter an atmospheric constituent, how large would that change be, where would it occur, and how would it affect the organism or activity in question? Each arrow has a magnitude and a timescale. A vivid scenario is not a substitute for measuring or modeling those links.

What should a fair retelling preserve?

Keep the underlying observation, the authors’ proposed interpretation, and the published challenge visible. State which parts are established across independent records and which need further testing. Do not turn a disputed consequence into a settled fact by repeating only the original headline.

A useful final step is to write two sentences about the same study. The first should describe what was measured. The second should describe what the authors inferred beyond it. If those sentences become identical, you may have skipped an important layer of reasoning.

The excursion’s story grows richer through this separation. A tree, an ice core, and a lava flow do not preserve the same variable, yet they can constrain one another. The strongest reconstruction uses that diversity while resisting the temptation to make one dramatic date explain every event near it.

Does this make the next reversal predictable?

The historical record does not reveal a regular reversal schedule. Present changes in field strength or a regional weak area do not by themselves establish that a global reversal is imminent.

A 2018 study comparing recent field behavior with past excursions illustrates how researchers test such analogies rather than extrapolating one declining trend indefinitely. Its conclusion belongs to the data and models considered, not to a universal guarantee about all future geomagnetic behavior.

A useful thought experiment is to compare two time series that both decline over a short interval. One later recovers; the other continues into a larger transition. The early segment alone may not distinguish them. More observations and a physical model are needed, and even then forecasting has limits.

Read the archive, not an apocalypse poster

Choose one published Laschamp figure and identify whether it shows direction, relative intensity, cosmogenic production, or a model-derived dipole moment. Then read its time axis and uncertainty. Those quantities are related but not interchangeable.

The excursion’s real achievement is that an invisible episode can be reconstructed at all. Lava, mud, and ice each preserve an imperfect part of the record. The deeper story appears when their imperfections are understood well enough to let them speak together.

Sources and a next step

Continue exploring art, ideas, and unexpected connections at Incoprea.
Wednesday, October 14, 2026

Oklo: The Nuclear Reactors That Nature Built Long Before Humans

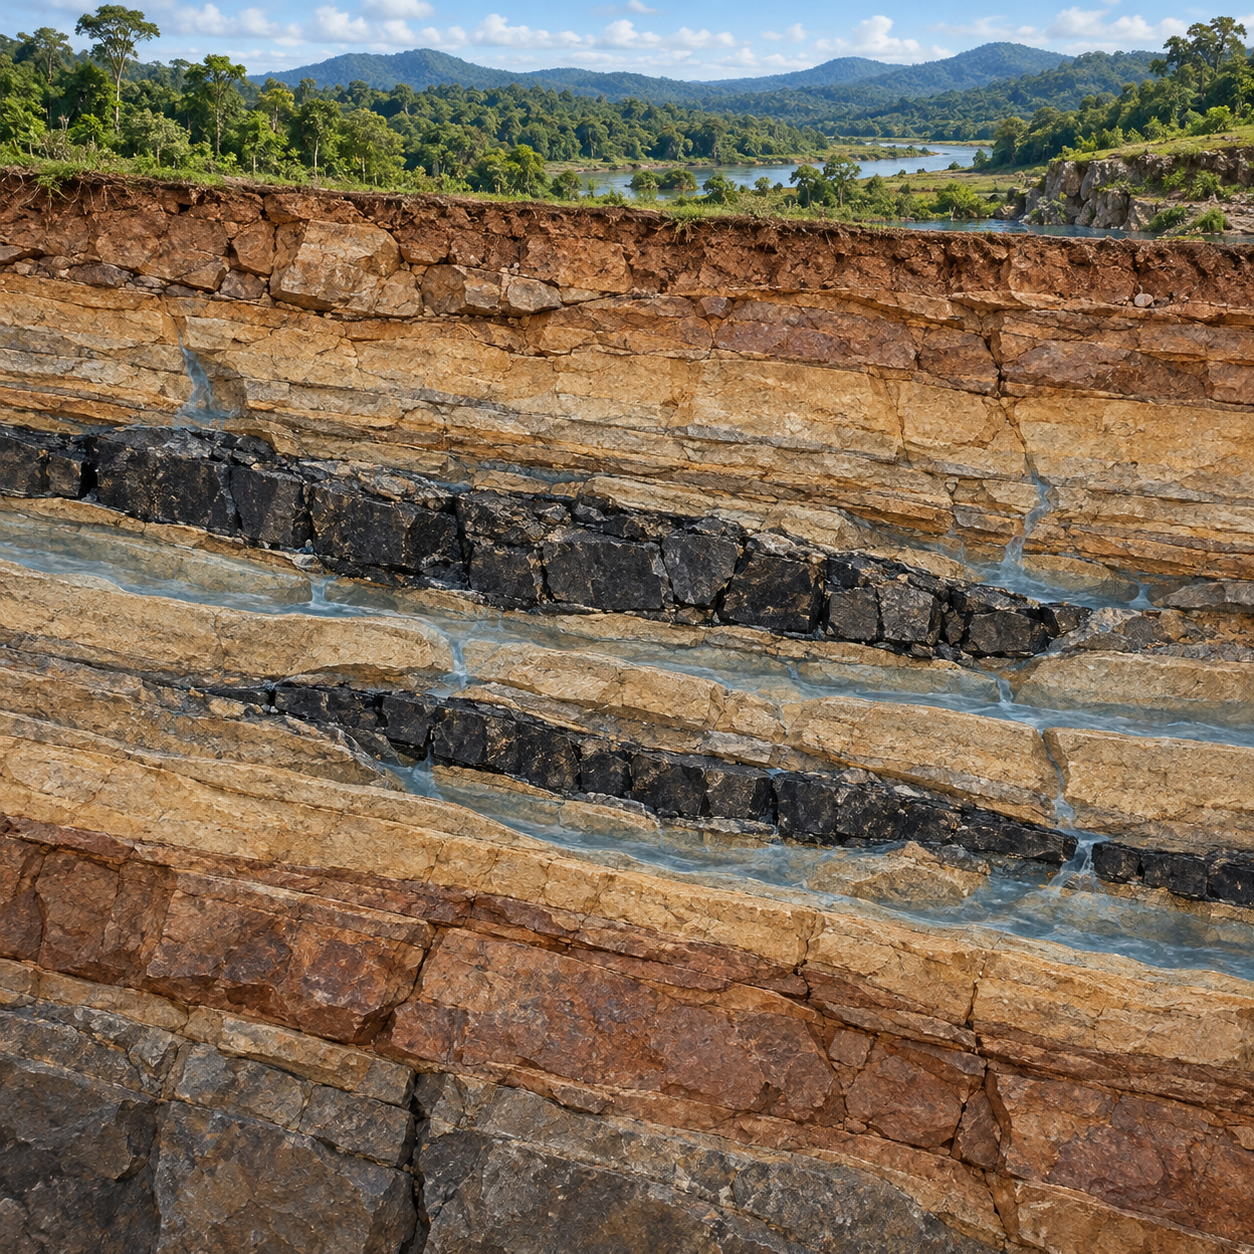
Conceptual cutaway illustration of dark uranium-bearing seams and groundwater in layered rock.
A conceptual ore-and-groundwater cutaway, not a reconstruction of an exact Oklo reactor zone.

A rock can preserve a footprint, a ripple or the remains of an ancient organism. At Oklo in Gabon, some rocks preserve evidence of something less expected: sustained nuclear chain reactions that operated roughly two billion years ago.

No ancient civilization built them. There were no turbines, control rooms or concrete domes. A particular arrangement of uranium-rich ore and water allowed natural fission reactions to occur inside the ground. The landscape supplied conditions that humans would much later learn to assemble deliberately.

A missing isotope starts the investigation

The discovery emerged in 1972, when scientists examining uranium from Gabon noticed an unexpectedly low proportion of uranium-235. Isotopes are versions of an element with different numbers of neutrons. Uranium-235 is especially important because it can sustain a chain reaction under suitable conditions.

The unusual composition was more than a measurement curiosity. Investigators found evidence that some uranium-235 had been consumed, along with characteristic isotopic patterns in other elements left by fission and neutron capture. Together, those clues pointed to natural reactor zones within the deposits.

This is a kind of geological detective work: the original activity has ended, but its effects on atomic proportions remain. Instead of watching an ancient reaction, researchers reconstruct it from the materials it changed.

Why the ancient Earth could do it

Uranium-235 decays faster than uranium-238, so its proportion in natural uranium was higher in the distant past. Around the time the Oklo reactors operated, the available mixture was more favorable for a chain reaction than ordinary natural uranium is today.

The ore also needed a sufficiently high uranium concentration and a suitable physical arrangement. Water acted as a moderator, slowing neutrons so that they could more effectively trigger further fission in uranium-235. Other materials that absorb too many neutrons could interfere with the process.

A chain reaction is a balance, not a spark

A uranium atom undergoing fission can release neutrons that may trigger further fissions. For a sustained chain, enough of those neutrons must cause new reactions rather than escape the active region or be absorbed without continuing the chain. The ore's geometry and surroundings therefore matter along with the amount of uranium present.

Water's moderator role is easy to confuse with fuel. In the described natural system, it helped slow neutrons; it was not the main store of nuclear energy being consumed. Losing water could consequently change the efficiency of the chain. A substance can be essential to a reaction's operation without being the source of most of its released energy.

Researchers have used retained fission-product information to infer intermittent behavior in parts of the system. Such reconstructions depend on models of operating conditions. It is safer to think of a set of ancient reactor zones with histories to investigate than of one uniform machine following an identical timetable everywhere.

The difference between past and present uranium mixtures is equally important. The larger ancient proportion of uranium-235 helped make those arrangements possible. “Natural” does not mean “ordinary under today's conditions.” The historical isotope mixture and the geological concentration both belong to the explanation.

The past becomes a laboratory

Oklo offers information about how elements move through rock and how ancient nuclear reactions can be reconstructed. Researchers also use its isotope records to investigate whether fundamental physical constants might have changed over geological time.

Those studies require care. Interpretations depend on models of temperature, water content, neutron energies and the original geometry. A remarkable natural archive does not remove uncertainty about every detail of its operation.

The reactors are long extinct, and their existence does not imply ordinary rocks are poised to start producing nuclear power. The necessary circumstances were unusual and belonged to a different atomic composition of the Earth.

Reconstruct the investigation from the discrepancy

Begin with the unexpected isotope ratio. By itself, a slightly unusual measurement calls for checking the sample, the instrument and alternative explanations. It does not instantly supply a complete history of a natural reactor. The additional isotopic signatures associated with fission and neutron capture made the case much stronger.

This is a useful detective exercise because the first clue was small while the inference was enormous. List the measured differences separately from the proposed process that links them. Then ask which other traces that process should leave. A powerful explanation accounts for several independent features instead of simply giving the original anomaly an exciting name.

The same approach clarifies claims about long-term retention of radioactive products. Evidence that some elements remained near their original setting can inform geochemical research, but elements differ in mobility and the surrounding rocks have their own history. It does not establish that every product stayed completely fixed or that every modern waste-storage setting would behave the same way.

Likewise, using Oklo to constrain changes in fundamental constants involves more than comparing ancient and modern ore. Researchers must model neutron energies, temperatures and material composition to interpret the isotope record. The archive is valuable precisely because detailed physical questions can be asked of it. Its age does not make those questions disappear; it makes the care with which they are answered more consequential.

Sources and further reading: IAEA Bulletin: Meet Oklo · IAEA: Early investigation of the Oklo phenomenon · Davis, Gould and Sharapov: Oklo reactors and nuclear science

Famous Last Meals is now in paperback — stories, history and 25 recipes

Famous Last Meals: Stories, History, and Recipes is now available in paperback on Amazon. The illustrated collection brings together 23 his...