Showing posts with label Space Weather. Show all posts

Thursday, October 22, 2026

The South Atlantic Anomaly Is a Spacecraft Problem With a Deep-Earth Story

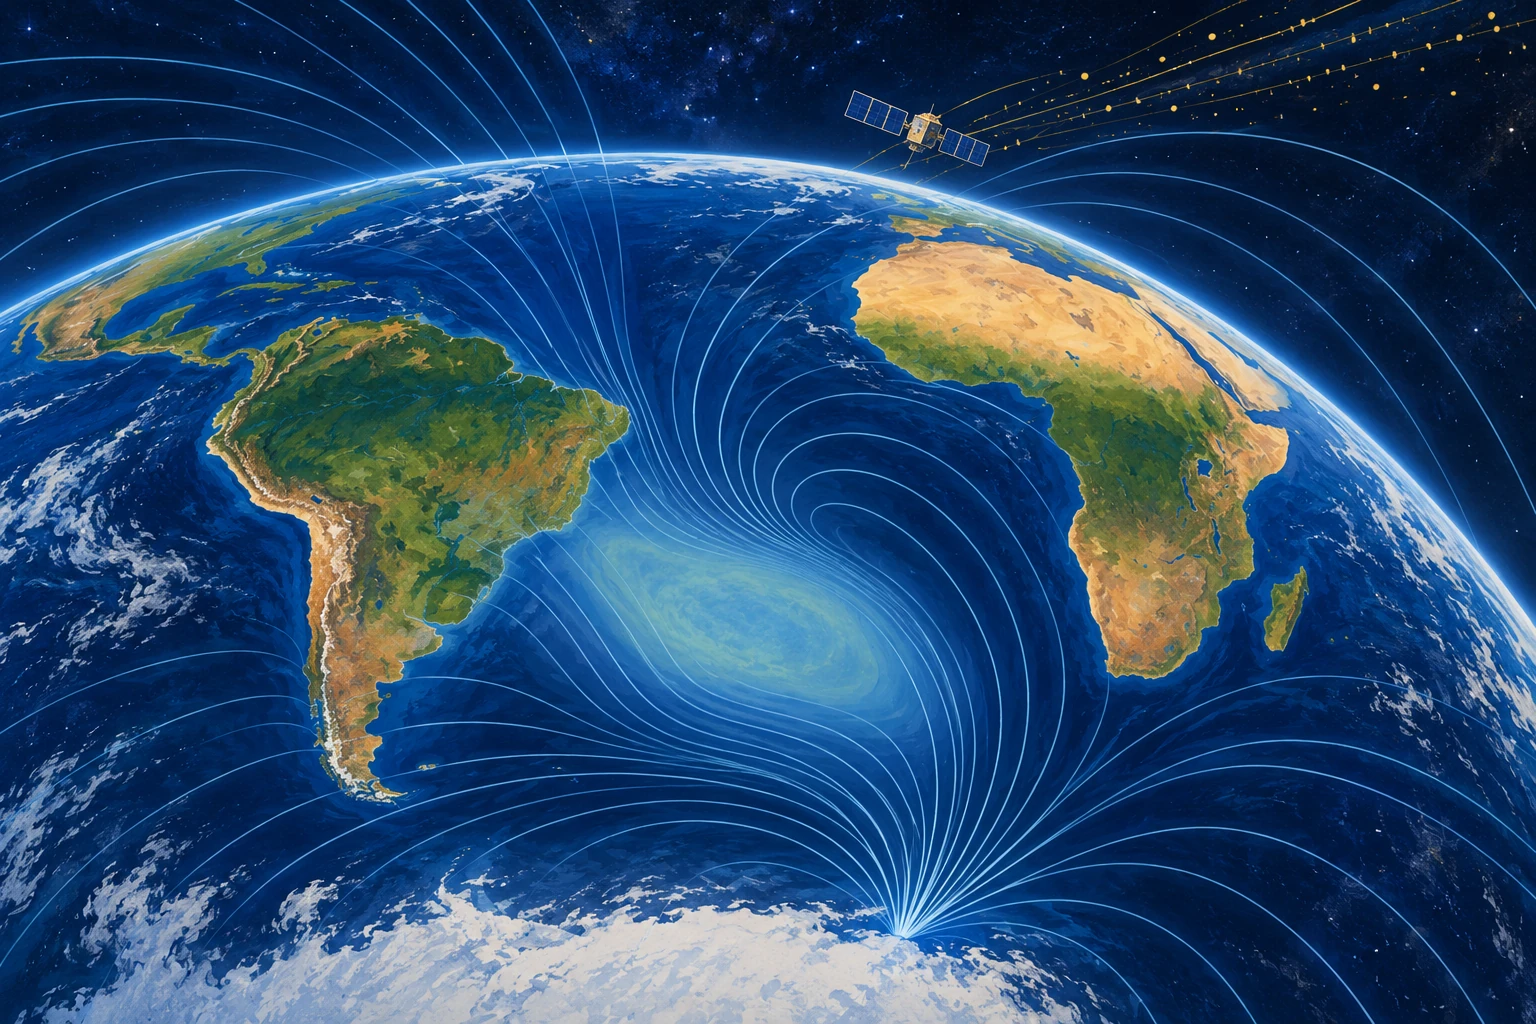
Conceptual Earth view centered on the South Atlantic with pale magnetic contours and a tiny satellite amid sparse particle dots.
AI-generated conceptual illustration of the South Atlantic Anomaly. The patch, field lines, and particles are schematic, not a radiation or magnetic-intensity map.

A spacecraft can cross the South Atlantic and encounter a radiation environment that differs markedly from another part of the same orbit. The region is associated with an unusually weak portion of Earth’s magnetic field: the South Atlantic Anomaly, or SAA.

Its name sounds like a mysterious hole. The reality is more specific and more useful. A changing, asymmetric magnetic field alters where trapped energetic particles can reach low orbital altitudes, creating an operational problem for instruments and a scientific clue to processes deep inside Earth.

There is no missing patch of planet

Earth’s field is largely generated by electrically conducting fluid motion in the outer core. It is neither perfectly centered nor a simple permanent bar magnet. Regional features ride on top of a broader dipole-like structure.

NASA’s account of the anomaly connects the weak-field region with the radiation conditions faced by satellites. The “dent” is a metaphor for field geometry and intensity, not a cavity in the atmosphere or a hole through which empty space pours.

Magnetic-field strength and particle flux are related but different quantities. A map of surface field intensity is not automatically a radiation-dose map for a spacecraft at a particular altitude. Orbit, particle energy, detector sensitivity, and time all matter.

The spacecraft consequence is concrete

Energetic particles can disturb electronics, create spurious detector events, degrade components, or interrupt observations. Operators may schedule protective actions or pause sensitive measurements during passages through a hazardous region.

NASA’s ROSAT material provides an example of the anomaly’s relevance to an astronomical mission. An observation gap can therefore reflect an instrument protecting its data or hardware, rather than an absence of interesting objects in the sky.

Imagine a telescope trying to count faint X-ray photons while charged-particle events increase its background. The problem is both reliability and interpretation: which detector signals came from the astronomical target, and which arose from the local environment?

A field that changes in more than one place

ESA’s October 2025 Swarm report describes changes observed between 2014 and 2025, including expansion of the weak-field area and differing behavior toward Africa and South America. The anomaly is not a rigid patch drifting intact across a map.

The report links the behavior to reverse-flux features near the core-mantle boundary. These are inferred aspects of the magnetic field at depth, constrained through observations and modeling. Nobody has placed a camera beside the outer core to film a magnetic patch.

The difference between model inference and direct view matters because a global field model combines several sources. Satellites measure contributions from the core, crust, oceans, ionosphere, and magnetosphere. Separating them requires careful treatment of location, time, and external activity.

What a satellite constellation adds

Multiple spacecraft and ground observatories help constrain spatial structure and temporal change. The CHAOS-7 model paper documents a field model built from several satellite missions and observatory data, then uses it to study the SAA and other changes.

A time sequence is especially valuable. A single map can show a weak region. A consistent series helps estimate how that region evolves and whether different parts behave differently. Data processing must still distinguish a real change from a change in sampling or model construction.

When comparing two published maps, check the altitude, field quantity, color limits, date, and contour threshold. If the colors are rescaled independently, a weak-looking area on one map may not be numerically comparable with the same shade on another.

Draw two maps that answer different questions

For a paper exercise, sketch a surface magnetic-intensity map and a spacecraft radiation-count map. Give each a separate legend. Now ask which map helps investigate the core and which helps an instrument operator plan a passage.

The answer is not exclusive—both can inform both tasks—but the measured quantities differ. Add a second orbit at a different height. Its detector need not record the same counts over the same ground location. This is why “over the anomaly” is incomplete without orbital context.

The exercise is conceptual, not a radiation model. It makes a common visual shortcut visible: a two-dimensional map can hide the three-dimensional environment through which a satellite actually moves.

A forecast is not a photograph from the future

Geomagnetic forecasts combine physical understanding, recent observations, and assumptions about evolution. A graphic that includes projected years should label the boundary between observations and forecast. Otherwise a viewer may treat a modeled future shape as a measurement already made.

That distinction also applies to popular animation. Smoothly moving colors interpolate between states; they do not mean the field was observed continuously at every point. The underlying model and its uncertainty determine what the animation can support.

Make a caption test before sharing an anomaly image: replace “the hole is growing” with the actual plotted quantity, date interval, and threshold. If those details are missing, the picture may still be informative, but its apparent boundary should not be treated as a precisely measured wall. A contour is a selected value in a continuous field.

Does a weak region announce a reversal?

Not by itself. USGS guidance on reversals explains that the geological record contains changing polarity and excursions without a regular reversal timetable. A regional anomaly is not sufficient evidence for a dated prediction of a global transition.

It is equally unhelpful to describe the field as either perfectly protective or completely absent. The magnetosphere and atmosphere have different roles, and the SAA’s practical concern is especially clear for spacecraft. A sensational ground-level catastrophe does not follow from an operational satellite hazard.

The useful anomaly

Read an actual mission description and look for its measurement altitude, detector type, and data-screening rules. Then return to the field map. The connection between them becomes more concrete than a frightening red circle.

The SAA is compelling because one regional pattern connects a telescope’s noisy detector, the motion of charged particles, and liquid-metal processes thousands of kilometers below our feet. It becomes more interesting as those links become more precise.

Sources and a next step

Continue exploring art, ideas, and unexpected connections at Incoprea.

Chorus Waves: The Space Sounds That Help Shape the Radiation Belts

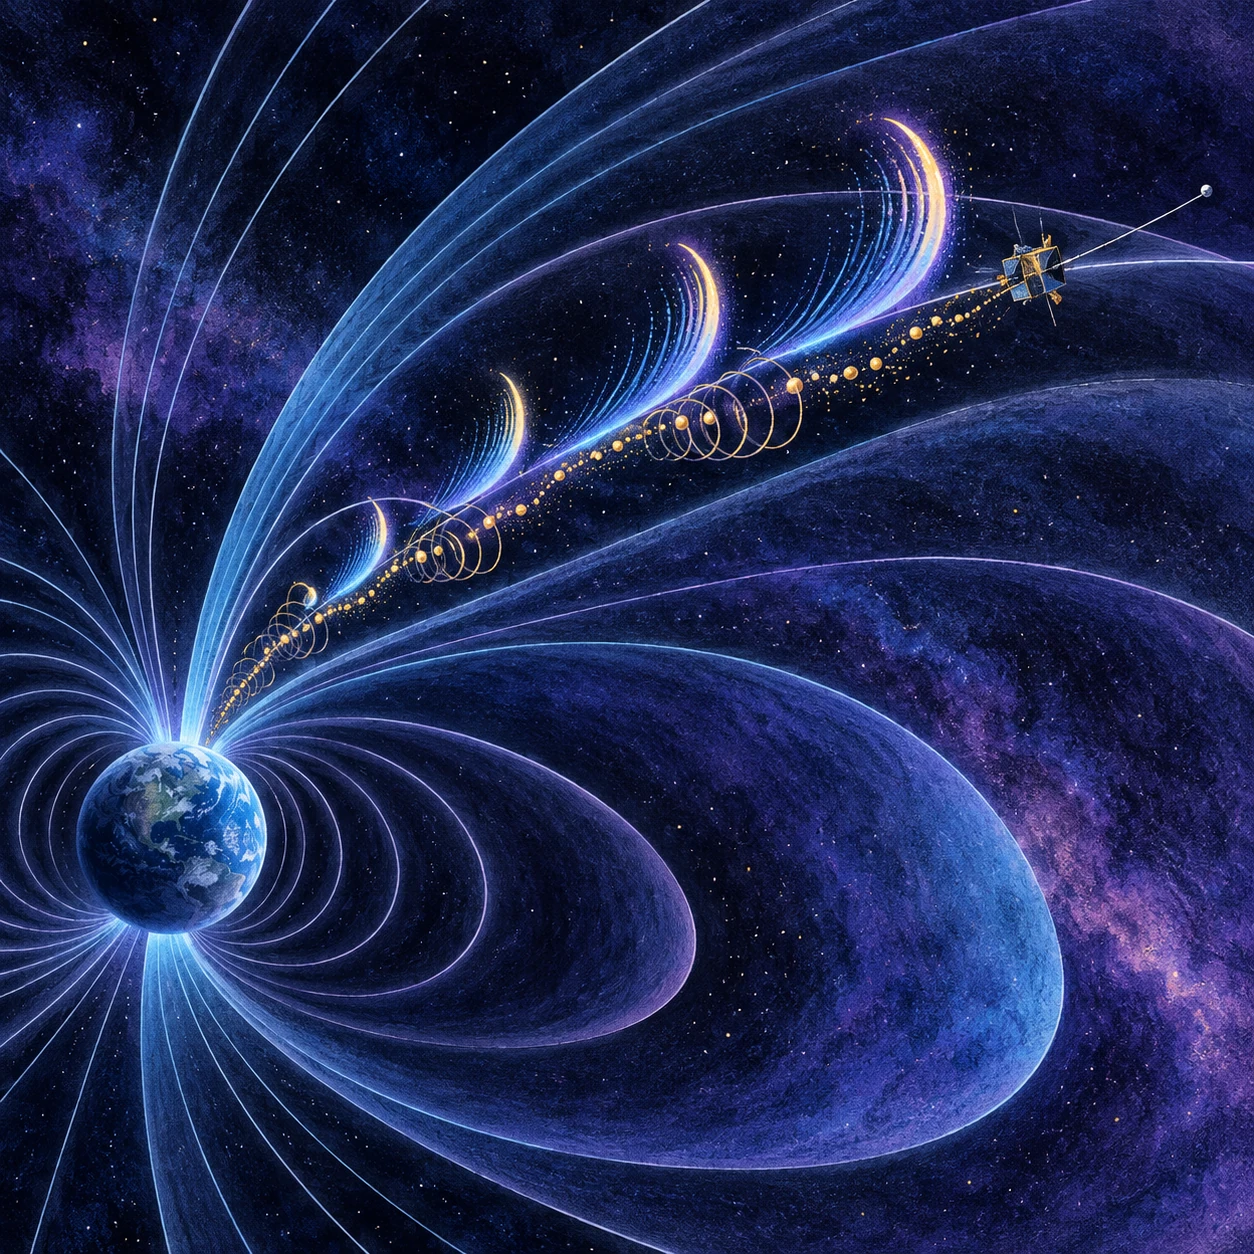
Screenprint-style conceptual Earth magnetic field with chirp-shaped arcs, spiral electron dots, and a small antenna-equipped spacecraft.
AI-generated conceptual plasma-wave artwork. Arcs and dots visualize invisible fields and particles; the article links an actual NASA measurement recording.

The recording sounds like a flock of electronic birds. Chirps rise in pitch, overlap, and stop. Yet no microphone was hanging in an air-filled sky beside the spacecraft. The instrument measured electromagnetic fluctuations in plasma, and those measurements were converted into audible sound.

These are chorus waves. Their memorable audio is an entry point into a physical process that can exchange energy with electrons and help reshape Earth’s radiation belts.

What the spacecraft actually hears

A plasma contains charged particles that respond to electric and magnetic fields. Wave instruments measure changing fields rather than pressure variations in air. Some plasma-wave frequencies can be represented directly within the human hearing range; other presentations alter timing or frequency to make features audible.

NASA’s explanation of space recordings makes the conversion part of the story. The sound is a presentation of real measurements, but it is not what an unprotected human ear would hear floating outside the spacecraft.

This distinction does not reduce the scientific value of listening. Hearing can make repeated tones, abrupt onsets, and changing patterns easy to notice. The essential requirement is knowing what variable was mapped to the audio.

Why the tones rise

Chorus often consists of short, structured emissions whose frequency changes over time. A spectrogram plots time horizontally, frequency vertically, and signal strength by color. Rising tones become sloping streaks, turning a birdlike impression into a measurable pattern.

NASA’s discussion of whistler-mode waves distinguishes chorus from other emissions such as plasmaspheric hiss. The names describe recognizable signatures, while the physical interpretation concerns wave propagation and interactions with particle populations.

Frequency is not particle speed. A bright patch on a spectrogram is also not a visible cloud of electrons. Read each axis and color key before assigning a physical image to the plot.

Energy can move between waves and particles

Electrons spiral around magnetic-field lines while also moving along them. Under resonance conditions, their motion can interact strongly with a wave. Energy can be transferred in ways that accelerate some electrons or change their pitch angles so that they are more likely to enter the atmosphere.

NASA’s account of radiation-belt acceleration describes how chorus-related wave interactions can contribute to high-energy electron populations. The belt is not a static container filled once and left alone. Sources, transport, acceleration, and losses continually compete.

A wave can therefore be relevant to both an increase and a decrease in particular particle populations, depending on energy, location, wave properties, and the interaction. “Chorus makes radiation” is too blunt an account of the system.

A listening exercise with a real recording

Open NASA’s chorus recording from the Van Allen Probes. Keep the volume comfortable and first listen without watching. Notice whether the tones rise, fall, repeat, or overlap. Then watch the associated spectrogram and connect each audible feature with the frequency-time structure.

On a sheet, draw the simplest chirp you hear as a line whose height represents pitch. Compare it with the spectrogram. Does a louder sound correspond to the line moving upward, to a brighter color, or to both? The exercise separates frequency from strength.

Finally read the recording date and instrument caption. A short clip is one sample of a changing environment, not the constant soundtrack of all space. The visual colors and audio gain are presentation choices that should not be mistaken for absolute loudness in a vacuum.

Laboratories can ask controlled questions

NASA-supported laboratory work on chirping waves describes experiments used to develop predictions and compare them with spacecraft observations. A laboratory plasma cannot reproduce every scale of Earth’s magnetosphere, but it can test specific parts of the mechanism under controlled conditions.

The comparison is strongest when the relevant physical relationships are identified explicitly. A similar-looking chirp alone is not enough. Researchers need to connect the wave, particle distribution, background field, and energy exchange.

This is the same logic that makes many scaled experiments useful: the setup reproduces a selected physical relationship, while the differences from nature remain part of the interpretation.

A spectrogram also lets you compare two chirps quantitatively without claiming to solve the plasma interaction. Choose a clear streak and note its starting and ending frequencies and elapsed time. The ratio of frequency change to duration gives an average sweep rate in hertz per second. Repeat for another streak and compare the signs and approximate slopes. Treat overlapping or faint features separately rather than drawing a clean line through them. The result is a descriptive measurement of the displayed data, not a particle-energy estimate. To connect it with electron dynamics, researchers need the field strength, particle distributions, propagation direction, and a suitable theory. That extra information is precisely what turns a captivating soundtrack into an experiment.

An unexpected place to find the chorus

A 2025 study by Liu and colleagues reported chorus emissions in Earth’s stretched magnetotail and examined field-particle energy transfer. The setting extended observations beyond the more familiar near-planet dipole-like environment.

The result is interesting because it tests assumptions about where chorus can form and how the nonlinear interaction works. It does not imply that every plasma everywhere must produce the same sound. A newly observed setting widens the evidence and prompts more specific questions.

Turn the soundtrack back into physics

After listening, try writing one sentence for each of three layers: the measured quantity, the representation, and the physical inference. For example: an instrument measured electric-field fluctuations; the data became a spectrogram and audio; analysis investigated wave-particle interaction.

Keeping those layers separate lets the audio remain both beautiful and honest. The chirps are not imaginary, and they are not birds in space. They are an accessible rendering of a plasma process whose consequences can reach from satellite electronics to particles entering the upper atmosphere.

Sources and a next step

Continue exploring art, ideas, and unexpected connections at Incoprea.
The Elevator With Three Working Buttons

Case 50 · shortest-path challenge · Hard · About 10-15 minutes The archive elevator has a peculiar test mode. Its floor display works, but o...