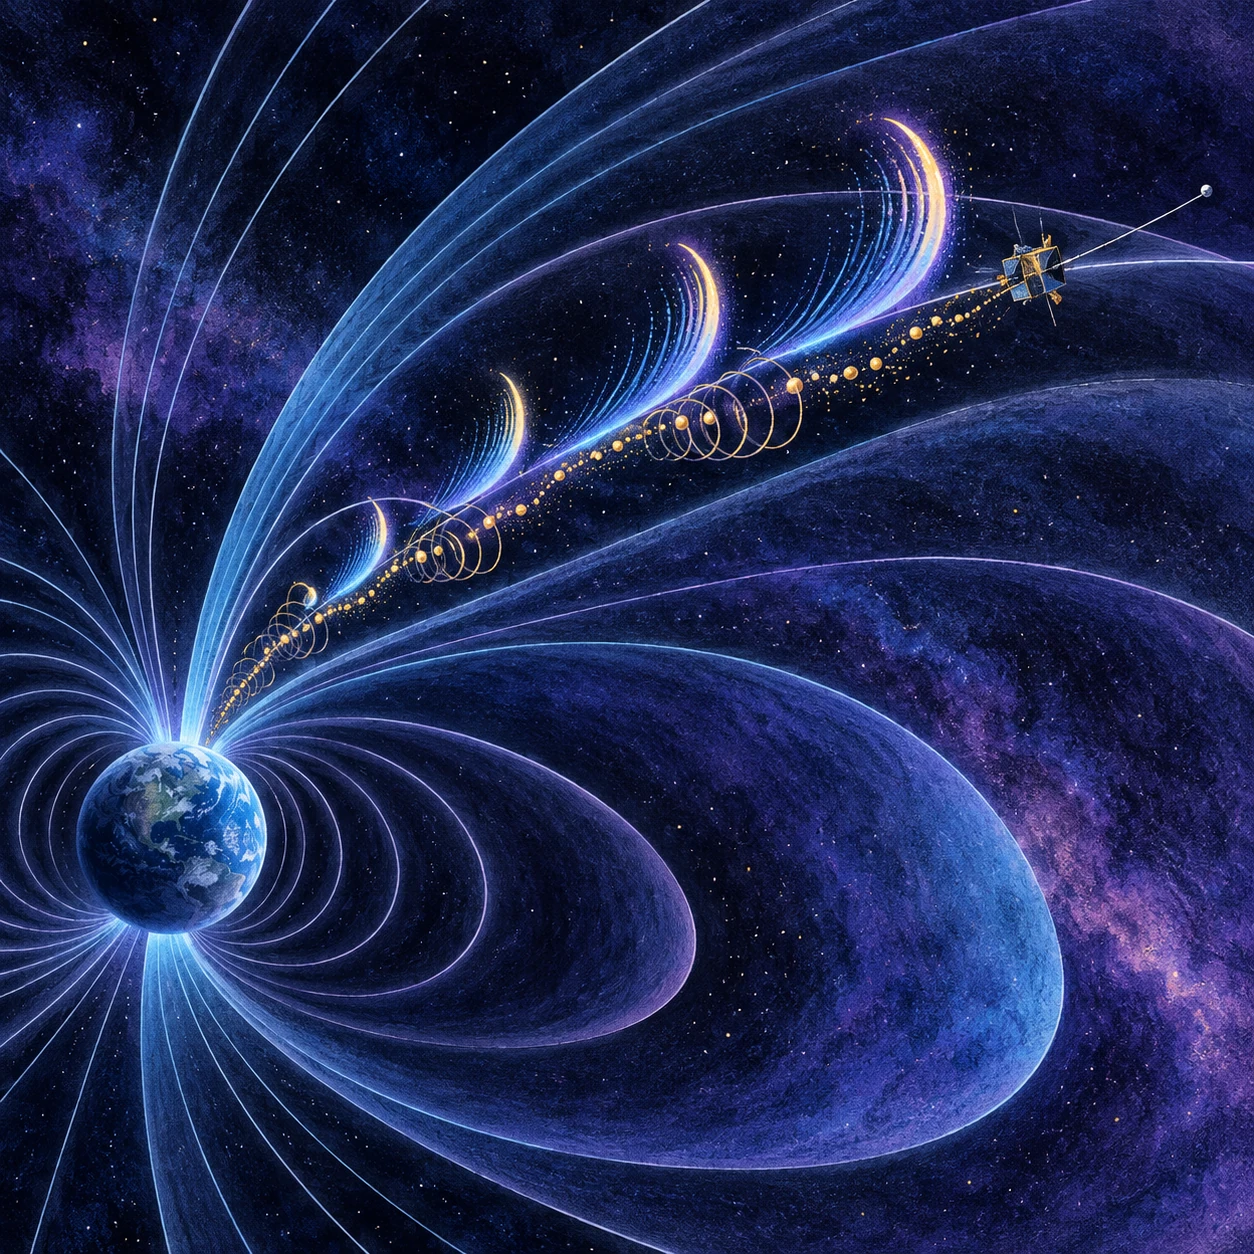
The recording sounds like a flock of electronic birds. Chirps rise in pitch, overlap, and stop. Yet no microphone was hanging in an air-filled sky beside the spacecraft. The instrument measured electromagnetic fluctuations in plasma, and those measurements were converted into audible sound.
These are chorus waves. Their memorable audio is an entry point into a physical process that can exchange energy with electrons and help reshape Earth’s radiation belts.
What the spacecraft actually hears
A plasma contains charged particles that respond to electric and magnetic fields. Wave instruments measure changing fields rather than pressure variations in air. Some plasma-wave frequencies can be represented directly within the human hearing range; other presentations alter timing or frequency to make features audible.
NASA’s explanation of space recordings makes the conversion part of the story. The sound is a presentation of real measurements, but it is not what an unprotected human ear would hear floating outside the spacecraft.
This distinction does not reduce the scientific value of listening. Hearing can make repeated tones, abrupt onsets, and changing patterns easy to notice. The essential requirement is knowing what variable was mapped to the audio.
Why the tones rise
Chorus often consists of short, structured emissions whose frequency changes over time. A spectrogram plots time horizontally, frequency vertically, and signal strength by color. Rising tones become sloping streaks, turning a birdlike impression into a measurable pattern.
NASA’s discussion of whistler-mode waves distinguishes chorus from other emissions such as plasmaspheric hiss. The names describe recognizable signatures, while the physical interpretation concerns wave propagation and interactions with particle populations.
Frequency is not particle speed. A bright patch on a spectrogram is also not a visible cloud of electrons. Read each axis and color key before assigning a physical image to the plot.
Energy can move between waves and particles
Electrons spiral around magnetic-field lines while also moving along them. Under resonance conditions, their motion can interact strongly with a wave. Energy can be transferred in ways that accelerate some electrons or change their pitch angles so that they are more likely to enter the atmosphere.
NASA’s account of radiation-belt acceleration describes how chorus-related wave interactions can contribute to high-energy electron populations. The belt is not a static container filled once and left alone. Sources, transport, acceleration, and losses continually compete.
A wave can therefore be relevant to both an increase and a decrease in particular particle populations, depending on energy, location, wave properties, and the interaction. “Chorus makes radiation” is too blunt an account of the system.
A listening exercise with a real recording
Open NASA’s chorus recording from the Van Allen Probes. Keep the volume comfortable and first listen without watching. Notice whether the tones rise, fall, repeat, or overlap. Then watch the associated spectrogram and connect each audible feature with the frequency-time structure.
On a sheet, draw the simplest chirp you hear as a line whose height represents pitch. Compare it with the spectrogram. Does a louder sound correspond to the line moving upward, to a brighter color, or to both? The exercise separates frequency from strength.
Finally read the recording date and instrument caption. A short clip is one sample of a changing environment, not the constant soundtrack of all space. The visual colors and audio gain are presentation choices that should not be mistaken for absolute loudness in a vacuum.
Laboratories can ask controlled questions
NASA-supported laboratory work on chirping waves describes experiments used to develop predictions and compare them with spacecraft observations. A laboratory plasma cannot reproduce every scale of Earth’s magnetosphere, but it can test specific parts of the mechanism under controlled conditions.
The comparison is strongest when the relevant physical relationships are identified explicitly. A similar-looking chirp alone is not enough. Researchers need to connect the wave, particle distribution, background field, and energy exchange.
This is the same logic that makes many scaled experiments useful: the setup reproduces a selected physical relationship, while the differences from nature remain part of the interpretation.
A spectrogram also lets you compare two chirps quantitatively without claiming to solve the plasma interaction. Choose a clear streak and note its starting and ending frequencies and elapsed time. The ratio of frequency change to duration gives an average sweep rate in hertz per second. Repeat for another streak and compare the signs and approximate slopes. Treat overlapping or faint features separately rather than drawing a clean line through them. The result is a descriptive measurement of the displayed data, not a particle-energy estimate. To connect it with electron dynamics, researchers need the field strength, particle distributions, propagation direction, and a suitable theory. That extra information is precisely what turns a captivating soundtrack into an experiment.
An unexpected place to find the chorus
A 2025 study by Liu and colleagues reported chorus emissions in Earth’s stretched magnetotail and examined field-particle energy transfer. The setting extended observations beyond the more familiar near-planet dipole-like environment.
The result is interesting because it tests assumptions about where chorus can form and how the nonlinear interaction works. It does not imply that every plasma everywhere must produce the same sound. A newly observed setting widens the evidence and prompts more specific questions.
Turn the soundtrack back into physics
After listening, try writing one sentence for each of three layers: the measured quantity, the representation, and the physical inference. For example: an instrument measured electric-field fluctuations; the data became a spectrogram and audio; analysis investigated wave-particle interaction.
Keeping those layers separate lets the audio remain both beautiful and honest. The chirps are not imaginary, and they are not birds in space. They are an accessible rendering of a plasma process whose consequences can reach from satellite electronics to particles entering the upper atmosphere.
Sources and a next step
- NASA: how space-wave recordings become sound
- NASA: chorus, hiss, and whistler-mode waves
- NASA: chorus and relativistic-electron acceleration
- NASA Video: Van Allen Probes chorus recording
- NASA: laboratory chirping-wave experiments
- Liu et al.2025: field-particle energy transfer in chorus
Continue exploring art, ideas, and unexpected connections at Incoprea.