Showing posts with label Design. Show all posts

Sunday, October 25, 2026

Netsuke: A Small Sculpture That Belonged to a Larger System

A tiny carved animal in a museum case can look entirely self-sufficient. It has a face, a pose and enough detail to reward a magnifying glass. But if it is a netsuke, part of its meaning lies outside the sculpture. Look for the cord openings. They point towards a larger arrangement of sash, cord, bead and suspended container.

Imagined carved toggle above a blue sash, with a bead, purple cords and a tiered lacquer case below.
An imagined netsuke ensemble brings toggle, bead, cord and case into one view.

Begin with the whole arrangement

A netsuke served as a toggle in a carrying system used with an obi, or sash. A cord passed behind the sash, leaving a container hanging below and the toggle secured above. The toggle prevented the suspended object from slipping through. The Seattle Art Museum’s ensemble makes this relationship explicit: its small case, called an inrō, belongs with a cord, a sliding bead and a netsuke.

This is more precise than saying that every Japanese garment lacked pockets and therefore required a miniature carving. Historical dress offered different ways to carry things, including folds, sleeves and separate containers. Netsuke are best understood within particular clothing practices and the popularity of suspended accessories. The system is specific; a universal claim about all kimono is not needed.

Seattle’s label places its example in the eighteenth to early nineteenth century and relates increasingly elaborate accessories to customers including merchants and samurai who could afford them. A practical device could therefore be a visible choice. The container and its fittings carried belongings, but they could also communicate taste and resources.

What each part contributes

The inrō is a small container, often made in fitted compartments. The ojime is the bead that slides along the cord and helps keep the arrangement closed. The netsuke is the stop above the sash. These words describe different objects with different tasks. A beautifully carved bead is not automatically a netsuke, and an inrō is not the name of the whole ensemble.

The V&A’s exhibition guide describes one set dated about 1750–1850: a lacquered inrō, a wooden netsuke and a bone ojime. It explains that such cases carried items including seals, ink pads and medicines. This example is a useful reminder that the components could use different materials. They did not have to be carved from a matching substance to work together.

Follow the cord mentally from the case, through the bead and up to the toggle. That route explains more than a row of isolated objects can. The carrying system depends on relationships: the cord must move where movement is wanted and be stopped where movement would release the load. Small changes in scale or placement could affect the whole arrangement.

A sculpture designed to encounter cloth

In the Met’s study of netsuke, curator Barbra Teri Okada explains the constraints imposed by use. A toggle had to be compact and durable, with a smooth form that could pass beneath the sash yet remain large enough to hold the suspended object. Cord openings, called himotoshi, had to be incorporated in a way that allowed the carving to hang appropriately.

These requirements help explain why a small animal might curl into a rounded mass rather than extend fragile limbs in every direction. The point is not that every netsuke looks alike. It is that sculpture and use had to negotiate. A projecting detail could be visually delightful while also vulnerable to rubbing, catching or damage.

Okada also draws attention to carving on the underside. A miniature is an object held and turned, not only a frontal picture. Its openings may be tucked into the composition or made on the back. Looking beneath the apparent “base” can reveal the feature that identifies its intended role. This is a good reason to explore multiple collection photographs rather than judge the object from one attractive view.

A case can carry a pattern as well as contents

The Met’s Inrō with Geometric Pattern, made in the first half of the nineteenth century, uses lacquer, metal and mother-of-pearl. Its record separately identifies the netsuke and a metal ojime with a chrysanthemum design. The museum interprets the inrō’s repeated pattern in relation to textile decoration. A portable accessory could therefore echo the patterned clothing around it.

The record gives us an ensemble to inspect, but it does not supply every episode in its history. We should not assume that every component now displayed together has always remained together since manufacture. Collection descriptions, inscriptions and provenance may help answer that question for an individual set. Visual harmony by itself cannot establish an unbroken original pairing.

A four-part looking route

  1. Find the container and count the visible sections.
  2. Locate the sliding bead.
  3. Trace the cord towards the toggle.
  4. Look for openings on the toggle’s back or underside.

If an image viewer will not rotate or enlarge, the Met’s medium description still identifies the components, while Seattle’s label explains their relationship. Use both kinds of evidence. A photograph reveals surface and shape; a catalogue entry can name a material or function that the photograph cannot securely establish.

A netsuke becomes more interesting when it is allowed to be both a sculpture and a working part. The carving rewards close attention, while the cord openings connect it to bodily movement and daily use. The small object does not lose its artistry when we restore its practical surroundings. Its artistry becomes easier to understand.

Explore more art, ideas and independent projects at Incoprea.

Volvelles: When a Book Asked the Reader to Turn the Page’s Machinery

Some books ask more of a reader than turning pages. A circular disc attached to a page can rotate over another disc, bringing marks, windows or pointers into a new relationship. The movement is small, but its effect is substantial: the reader operates part of the book. Devices of this kind are called volvelles.

Illustration of layered rotating paper wheels attached to an open book page.
An imagined paper instrument shows how a page can become movable.

A page that contains an instrument

The History of Science Museum in Oxford places volvelles within a larger tradition of paper instruments. Books and loose sheets could contain sundials, quadrants, astrolabes and other devices. Some were intended to be cut out and mounted. Others were meant to remain attached to a page, where moving components made a diagram usable.

A printed circle is not automatically a volvelle. The important difference is the designed movement of one part relative to another. A fixed diagram shows a relationship chosen by its maker. A movable diagram can present a range of relationships chosen by its user, within the rules built into the device. The page becomes something to manipulate as well as something to inspect.

Paper also changes the economics of an instrument. Oxford’s museum notes that printed devices could be disseminated more widely and cheaply than expensive brass examples. That did not make every paper instrument simple or inexpensive. An elaborate book could require substantial printing, hand assembly and careful finishing. The material allowed a range of possibilities, from affordable teaching tools to exceptional display objects.

Not every wheel did the same job

In Paper machines, Royal Society librarian Louisiane Ferlier introduces astronomical devices in the Society’s collections. A calendar published by Regiomontanus in 1474 includes a lunar volvelle. The article also discusses Johannes Schoener’s 1521 Aequatorium astronomicum, whose sequences of moving parts relate to the positions of celestial bodies. These are specific books with specific devices, not evidence for one universal paper calculator.

The Royal Society page includes a demonstration film. If the player does not appear, the article’s photographs and descriptions provide a useful fallback. Watch for the order of operations rather than trying to extract a scientific result from a brief view. Which wheel moves first? Which component stays fixed? Where does a reader obtain an input, and where would an output be read?

Those questions expose the work that a static photograph leaves hidden. An instrument may look crowded because several scales have to share the same surface. Motion can make that density manageable by aligning only the parts relevant to a chosen setting. A beautiful wheel is therefore also an interface, with assumptions about what its reader already understands.

Movement leaves a problem for preservation

A conservation study at France’s Institut national du patrimoine examines two editions of Jacques Bassantin’s astronomical work, dated 1599 and 1613. The study treats the volvelles as paper instruments mounted within books. It raises an especially revealing conservation question: how much movement should be preserved or permitted when movement itself can stress an old object?

A functioning replica can show an operation while protecting a fragile original. A digitized page can make small marks easier to read. Neither experience is identical to turning the historical device. Each preserves different kinds of access. The distinction matters because an object designed for use may have reached a point at which unrestricted use would damage the evidence of its own making.

Missing pieces create another difficulty. A book might retain the printed base of a wheel while losing a pointer, thread or rotating layer. It may still look complete to a reader who expects illustrations to be flat. Looking for attachment points and separate edges can therefore change an ordinary page into evidence of a lost mechanism.

The idea continued beyond early printed books

The Johns Hopkins Libraries hold the Barritt-Serviss Star and Planet Finder, published in 1906. Its board contains a central volvelle intended to relate a view of the sky to dates and times. The finding aid describes the claims of the object; it does not verify a particular present-day reading from it. The example shows that rotating paper devices were not confined to Renaissance volumes.

Calling a volvelle an “early computer” can be suggestive, but it may hide more than it explains. Some wheels perform a calculation; others organize information, illustrate a model or coordinate tables. It is better to ask what a particular device does than to award every moving circle the same technological ancestry.

Make a movement model without pretending to calculate the sky

Place one scrap-paper circle on a larger one and mark a triangle on the top disc. Turn it by hand while leaving the lower circle still. Notice how a fixed pointer would make one alignment easy to read. This is only a model of relative movement: it has no astronomical scale, prediction or historical claim.

The enduring surprise of a volvelle is that reading can involve an action with a material consequence. The reader sets something, compares something and observes what changes. A page need not contain electronics to respond to a hand. Its responsiveness can be built from cut edges, a central attachment and an arrangement of marks.

Explore more art, ideas and independent projects at Incoprea.

A Planimeter Measures an Area by Walking Its Edge

Put a tracing point on the edge of an irregular lake drawn on a map. Follow the shoreline until you arrive back where you began. A small mechanical wheel has turned during the trip, and its reading can tell you the lake's area.

The instrument is a planimeter. Its achievement is more surprising than measuring how far the point travelled. The useful result concerns the space inside the boundary, even though the tracing point never has to visit every patch of that interior.

Illustration of a two-arm polar planimeter resting over an irregular closed outline.
A polar planimeter turns a trip around a boundary into an area reading through the motion of a small wheel.

Find the fixed point, then the moving one

A polar planimeter commonly has two arms joined at an elbow. A weighted pole fixes one end in place on the drawing surface. A tracer at the other end follows the outline. The joint allows the arms to change their angle as the tracer moves.

A small measuring wheel responds selectively to that motion. It rolls readily in one direction and can slide sideways in another. Its axis is arranged along the tracer arm, so its rolling direction is perpendicular to that arm.

Consequently, the wheel does not simply register the distance travelled by the tracer. Different parts of the boundary contribute differently, according to the instrument's position and direction of movement. The net reading accumulates these contributions over a complete trip.

Royal Museums Greenwich's polar planimeter includes a weighted pole, a magnifying glass and a calibration checking bar. Those accessories make the purpose tangible. This was an instrument for making and checking measurements, with scales that had to be set and read.

How a boundary can account for an interior

Think first about a shape divided into adjacent little regions. A boundary shared by two neighbours is traversed in opposite directions when each region is walked around consistently. In a signed accumulation, those internal contributions cancel. Only the outside boundary remains.

That cancellation is a useful intuition for Green's theorem, which connects an appropriately defined accumulation around a closed curve with a quantity over its enclosed region. The planimeter's geometry makes a boundary accumulation correspond to area.

Oliver Knill's mathematical explanation at Harvard develops that connection explicitly. You do not need to perform the calculus to see why a closed trip matters. The instrument must finish the boundary account; stopping halfway leaves an incomplete result.

The signed nature of the measurement also matters. Reversing the direction of tracing reverses the sign of the ideal net accumulation. The physical area stays positive; the direction and instrument convention tell the operator how to interpret the reading.

Choose between distance and area

Try this paper puzzle. Draw a square 4 centimetres on each side. Next draw a rectangle 1 centimetre wide and 7 centimetres long. Both boundaries have the same total length: 16 centimetres. Imagine carefully tracing each with a correctly calibrated planimeter.

Should the two readings be equal because the tracing point travels the same distance? Decide before opening the comparison.

Compare the results

The square encloses 16 square centimetres; the rectangle encloses 7. An ideal area measurement distinguishes them despite their equal perimeters. A wheel that merely counted the tracer's total travelling distance would fail this test. The planimeter's selective rolling and changing geometry make the distinction possible.

Now give the square a small inward notch. Following the notch increases the distance traced while reducing enclosed area. That single alteration makes the difference between the two kinds of measurement especially clear.

On a real instrument, a narrow notch may also be harder to trace accurately. The mathematical distinction survives, while the practical difficulty reminds us that the operator's hand contributes uncertainty.

Read the map's scale twice

Suppose a traced region occupies 3 square centimetres on a map whose scale is 1:10,000. One centimetre represents 100 metres. A square centimetre therefore represents a square measuring 100 metres on each side: 10,000 square metres.

The region represents 30,000 square metres, or 3 hectares. Applying the linear scale only once would produce the wrong kind of quantity. Area requires scaling in two directions.

Two different conversions
On this mapOn the ground
1 centimetre of length100 metres of length
1 square centimetre of area10,000 square metres of area
3 square centimetres of area30,000 square metres, or 3 hectares

This calculation assumes the stated map scale applies appropriately to the region. A planimeter measures the drawing placed beneath it. It cannot repair a distorted reproduction or decide whether a thick shoreline should be followed along its inner edge, outer edge or centre.

A good reading begins before tracing

Inspect the Smithsonian's collection of polar planimeters and compare the weighted pole, arm adjustment and scale arrangements. Look for what would stay fixed and what would move. The photographs offer a usable object study without depending on old browser applets.

For an actual measurement, the outline has to be within the instrument's reach. The setup and calibration must suit the model and pole position. A broad loop enclosing the pole can require a different correction from an ordinary pole-outside measurement; the instrument's own instructions determine the procedure.

Repeating a trace tests consistency, while checking a known area tests calibration. Those are different questions. A person can repeat the same wrong setting very neatly.

The planimeter is a compact example of mathematics embodied in a mechanism. The weighted pole limits motion, the arms organise it, and the wheel adds selected parts together. By the time the tracer returns home, a trip around the edge has become an account of the space within.

Sources and further reading

Explore more art, stories and discoveries at Incoprea.

Saturday, October 24, 2026

One Tile Can Fill a Plane Without Giving It a Repeating Grid

A tabletop covered in repeated shapes seems to invite a repeating plan. Slide the pattern far enough, and surely the same arrangement should line up again. An aperiodic monotile challenges that expectation: one tile shape can cover the infinite plane while its geometry rules out every periodic tiling.

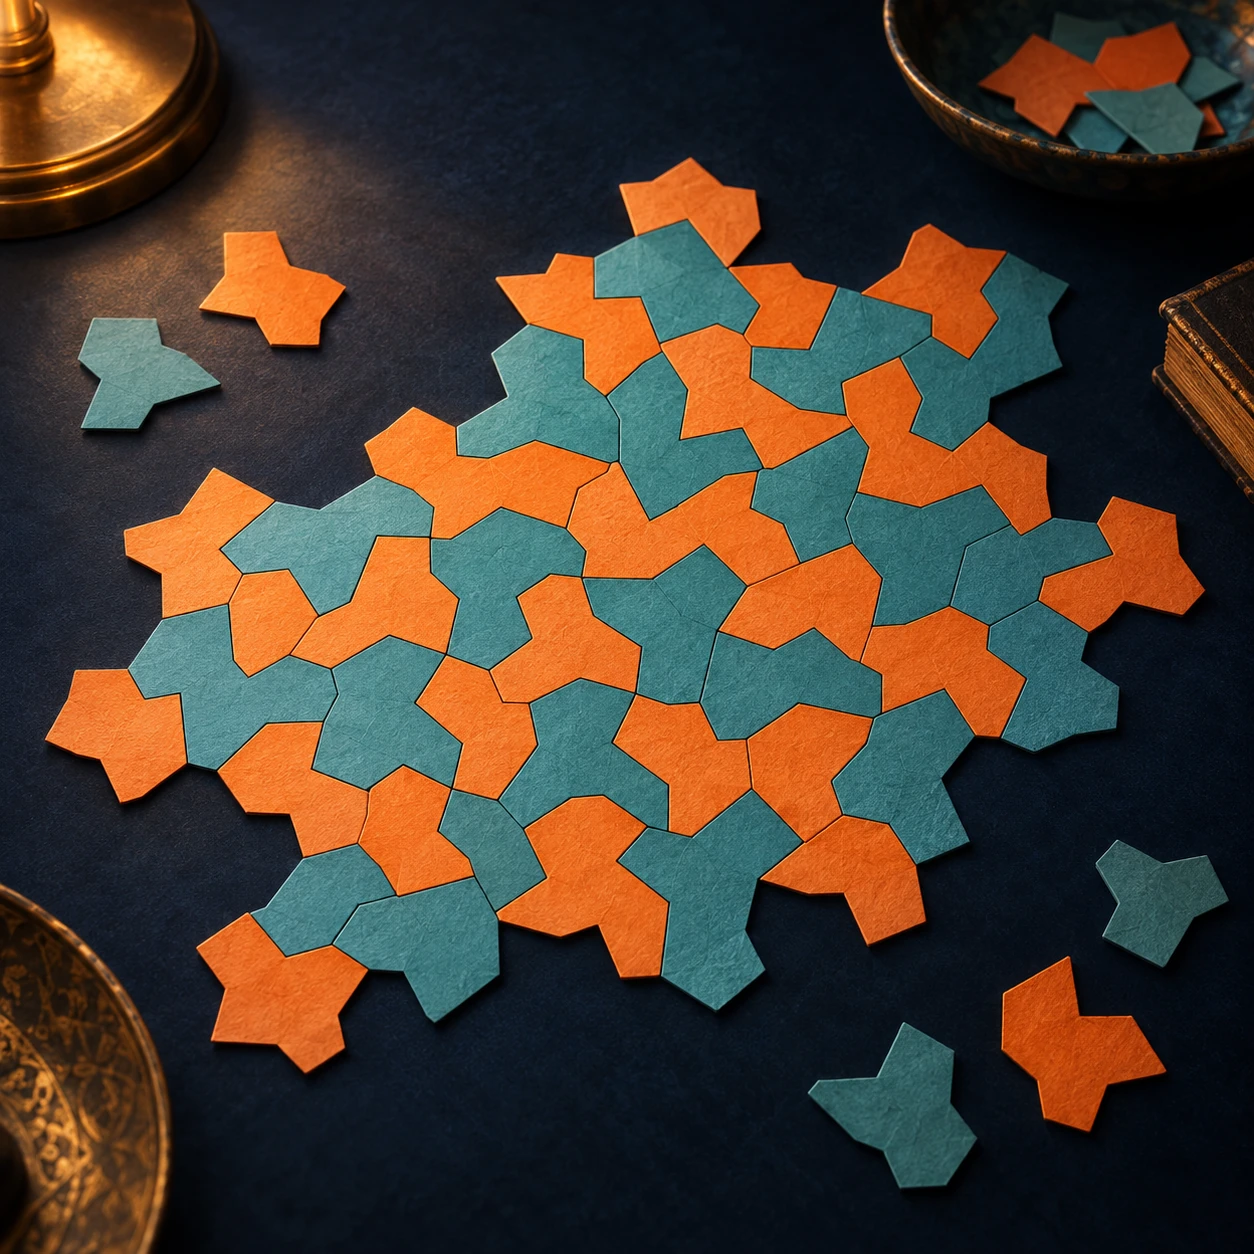
Orange and turquoise polygon paper pieces form an irregular patch on a dark tabletop.
Conceptual paper tiles introduce the search for structure. These shapes are not the mathematically certified hat; use the creators’ linked tools for its actual geometry.

The distinction is subtle and worth exploring slowly. The shape repeats, local clusters recur, and larger organization can still exist. What is absent is a nonzero translation that carries the entire infinite tiling exactly onto itself. Repetition of an ingredient is not the same thing as a repeating global grid.

First distinguish a choice from a constraint

You can arrange ordinary square tiles in colored patterns that never settle into a repeating color sequence. That does not make a plain square an aperiodic tile. The square also admits the familiar periodic grid. A shape that permits a nonperiodic arrangement has not necessarily forced aperiodicity.

In Smith, Myers, Kaplan, and Goodman-Strauss's hat paper, the authors prove that a particular polygon can tile the plane but cannot do so periodically. They establish larger clusters and hierarchical structure, rather than treating a visually irregular sample as a proof about infinity.

The illustration above uses conceptual paper pieces. They are not the certified hat geometry and should not be used to test its mathematical claim. The exact shapes, substitution tools, and proof resources are available on the creators' project page.

A small patch cannot display an infinite guarantee

Imagine a photograph of a very large floor whose repeating unit is wider than the photograph. Inside the frame, you might fail to find a repeat even though one exists elsewhere. Conversely, a local cluster can recur inside an aperiodic tiling without producing a translation that works everywhere.

This gives you a better question for an image: what exactly repeats, and how far does the evidence reach? A single tile, a cluster of several tiles, and the entire arrangement are different objects of comparison.

Visit the creators' interactive application through their project page. Begin with a small displayed patch. Choose a recognizable cluster and look for another occurrence, allowing rotation if you are studying local similarity. Then ask whether the same displacement carries every surrounding tile into agreement. Finding one matching cluster answers the first question, not the second.

The larger pieces have their own organization

The hat research constructs metatiles—clusters that can be treated as larger building blocks—and substitution rules. That hierarchical viewpoint links local fitting to the structure of arbitrarily large regions. An apparently irregular field can contain strong organization without possessing a repeating translational unit.

For a paper exercise, draw a box around one cluster in a screenshot from the creators' tool. Describe the cluster using position and orientation, not only color. Now imagine making the observation window larger. Which apparent matches survive when their neighborhoods are included? You are testing the scope of a local claim, while leaving the infinite theorem to the proof.

Color is especially tempting. The project images use color to help reveal arrangements, but the hat result concerns geometry without extra colored matching rules. If you mentally recolor a tile, you have not changed the polygon that fits against its neighbors.

Turning a tile over changes the question

The later chiral-monotile paper makes an important distinction explicit: every tiling admitted by the original hat mixes reflected and unreflected copies. The follow-up develops Spectre shapes whose geometry supports aperiodicity without requiring mirror-image copies in the same way.

Use a paper letter such as an asymmetric block shape to think about reflection. Rotating it on the table preserves its handedness. Flipping it over reverses that handedness. The operations are different even when a casual phrase such as “move the tile around” seems to include both.

A three-column pattern notebook

Record an observation, its scope, and the evidence needed to go further. For example: “this cluster appears twice”; “within this finite patch”; “does not establish a global period.” Then record the theorem separately: “the hat admits plane tilings but no periodic ones”; “all complete tilings”; “supported by the published proof.” Keeping the columns distinct makes close looking more valuable.

Finally, compare two kinds of order. A wallpaper repeat tells you how to continue by copying a fixed translational unit. A hierarchical aperiodic construction tells you how local pieces belong inside larger structures. Both can be highly organized. Only one needs a repeating grid.

The pleasure of the monotile is that a modest-looking outline can carry a demand extending far beyond any tabletop. Its edges do more than meet the next piece. Through the constraints they impose, they help determine what the whole plane can never become.

Sources and further exploration: Smith and colleagues: an aperiodic monotile; Creators: hat tools and exact geometry; Smith and colleagues: a chiral aperiodic monotile.

Explore all 50 new articles · Browse the complete illustrated collection

Explore more art, ideas, and independent projects at Incoprea.

Friday, October 23, 2026

The Space Between A and V Is Part of the Design

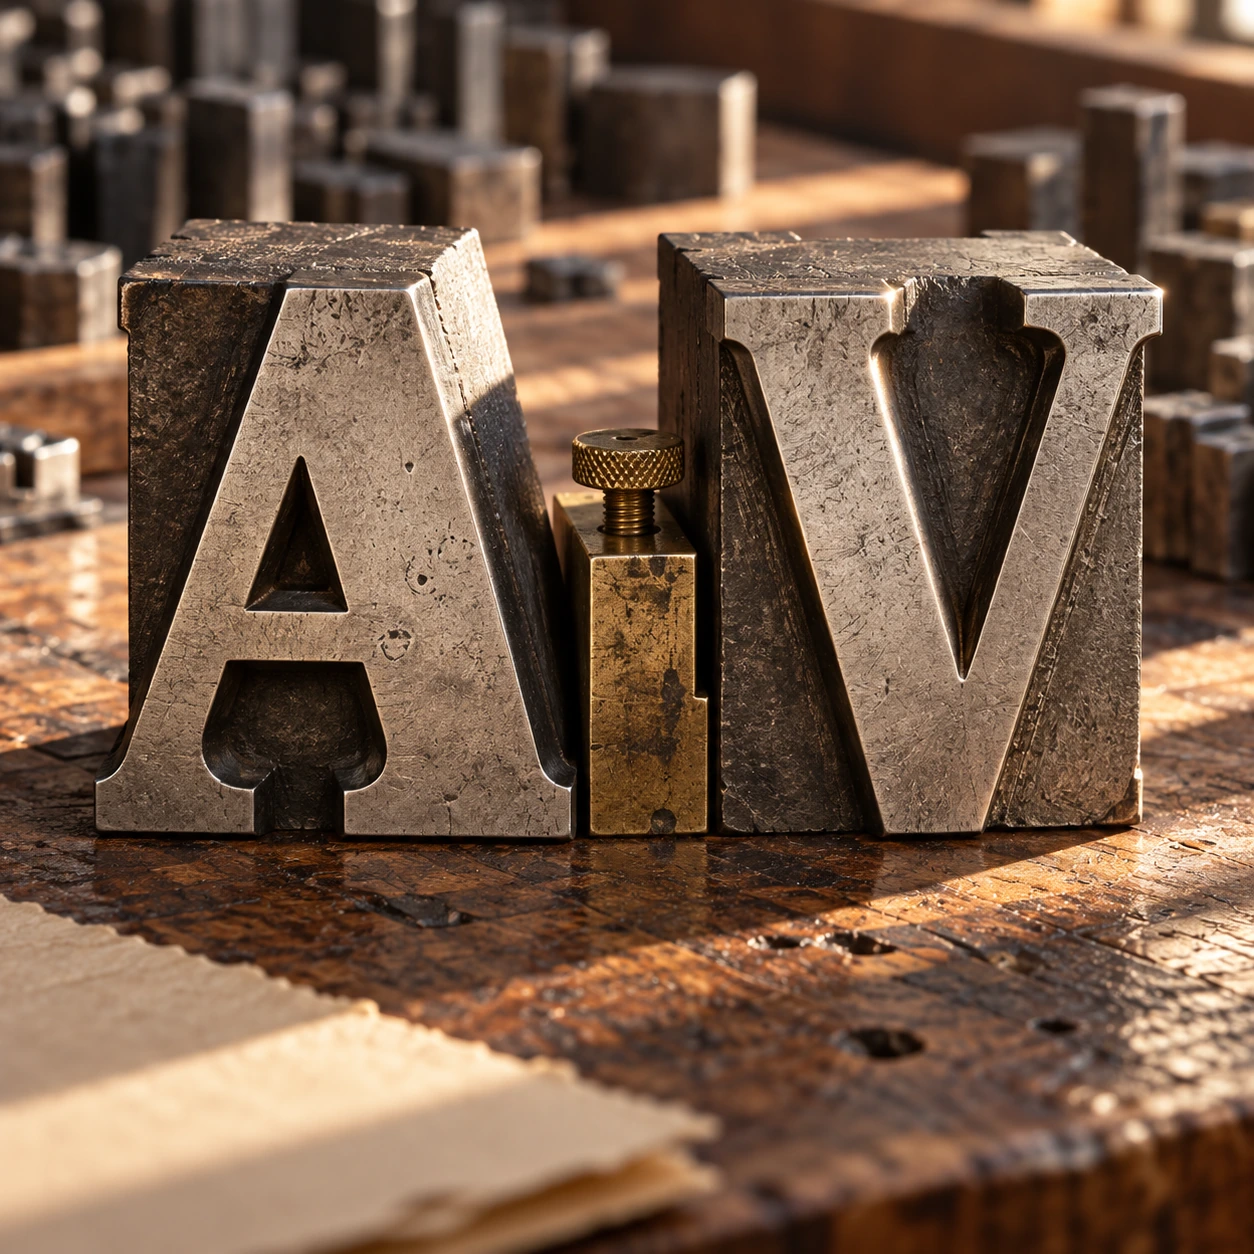
Put a capital A beside a capital V. Give the two letters perfectly ordinary rectangular spaces. The result can look as though a small hole has opened between them. Their sloping edges create a pocket of white that a ruler measures differently from the way a reader experiences it.

Metal A and V letter forms stand on a compositor’s workbench
A conceptual letterpress study of the forms and their intervening space.

Kerning adjusts the relationship between particular neighboring glyphs. It is a small intervention with a large perceptual effect, especially in headlines, titles, and logos. The aim is not equal numerical gaps. It is a coherent rhythm of forms and spaces.

Begin by looking at the empty shapes

A letter occupies more than the black shape you see. A font supplies metrics that position glyphs and advance the writing position for the next one. Those spaces allow ordinary text to run without a designer placing every character by hand. But some combinations need particular attention.

Compare AV, To, and HH. The first pair has facing diagonals. The second can tuck a round letter beneath an overhanging top stroke. The third places relatively straight sides near one another. Equal treatment of their bounding boxes does not automatically create equal-looking intervals.

The OpenType positioning documentation distinguishes placement from advance and describes pair adjustments. This is the underlying reason a font can carry instructions for particular combinations. The visible gap is an outcome of shapes and positioning, not a single universal width called “the space between letters.”

Adjust one pair of letters

Choose pair, font, size and manual gap; compare with normal browser kerning.

Open adjust one pair of letters in its own window.

Try the pair before the paragraph

The spacing tool disables automatic kerning for its controlled two-letter sample. Choose AV or To, then adjust the second glyph’s relative position. A separate reference shows the browser’s normal font behavior. The tool uses locally available font families, so the exact shapes can vary between devices.

Move too far in each direction before settling on a preference. An excessive gap makes the pair feel separated. Excessive tightening can make the forms collide or create a new shape that distracts from the letters. The useful setting is contextual, and it may change with the font, size, or neighboring letters.

Now reduce the displayed size. An adjustment that feels elegant at a huge scale can feel cramped when small. Looking only at an enlarged screenshot is a poor final check for a book title, a phone interface, or a printed label that will be read at a different size.

Three controls that answer different problems

Kerning changes particular pairs. Tracking changes spacing across a selected run of text. Word spacing changes the gaps between words. These controls can interact, but they are not interchangeable remedies for every uneasy line.

Adobe’s explanation distinguishes built-in metrics kerning, shape-based optical kerning, and manual adjustments. Metrics use information supplied with the font. Optical methods inspect neighboring forms. Manual work gives the designer control over a specific relationship.

Suppose a five-letter title has one conspicuous gap. Increasing or decreasing tracking changes all the intervals, including the ones that already look balanced. A local pair adjustment may solve the actual problem more precisely. Conversely, a whole line that feels too loose may need a range-level decision rather than a dozen unrelated pair fixes.

A short editorial exercise

Write an invented title such as “A Visit to Tomorrow” in the actual font and size intended for publication. The words are only a test phrase; they are not a logo or a supplied design asset. Read it first as language, then look away and return to the spaces.

Which interval attracts attention? Is it a gap between two letters, a word space, or a line break? Identify the kind of problem before moving anything. A title can look unbalanced because a short word is stranded on the next line even when every letter pair is well spaced.

Next compare the line at its intended reading size and at one smaller size. If the font has built-in kerning, let that be the starting point. Make one purposeful change, then compare again. A long sequence of unrecorded tiny nudges can leave you unable to explain why the current version is better.

Finally read the title in context. Place it above a paragraph, beside its cover image, or inside the available column. The surrounding space changes the impression. A pair that looks correct in isolation can still sit within a line that feels heavy on one side.

Separate paper A, V, T, and o glyphs cast small shadows
Look at the empty shapes between the letter forms as well as the forms themselves.

Why a browser can show a different gap

Web typography depends on which font actually loads, its available features, the browser’s shaping behavior, and the selected styling. A substitute font can change both letter shapes and metrics. A screenshot therefore records one rendered result, not a guarantee about every reader’s device.

The W3C font specification defines the control over using kerning information. In the tool, the manually spaced sample is deliberately split into separate glyph elements to expose the movement. That demonstration is not a recommendation to build ordinary running text one letter at a time.

Complex writing systems can require contextual shaping and positioning that go far beyond the familiar Latin AV example. Treating all text as isolated decorative letters can break those relationships. The narrow exercise here teaches a visual spacing question; it is not a general prescription for typesetting every script.

The best adjustment is usually quiet

Readers rarely congratulate a paragraph for its absence of distracting gaps. They simply continue reading. That is the useful standard: does the spacing support the word, the line, and the intended pace without repeatedly calling attention to itself?

Once you notice the negative shapes around letters, a title becomes a set of relationships rather than a row of symbols. The craft is in making those relationships feel deliberate. Sometimes the most visible improvement is the removal of a tiny interruption you had not previously known how to name.

Follow the evidence: Adobe: kerning and tracking; Microsoft: OpenType glyph positioning; W3C: CSS font kerning.

Explore all 80 new articles · Browse the complete illustrated collection

Explore more art, ideas, experiments, and independent projects at Incoprea.

Three Jobs That Need Three Different Maps

You are given three jobs and one blank map. The first job is to compare how much land two regions contain. The second is to plot a constant compass course. The third is to measure how far several cities lie from one chosen center. A single familiar world map is unlikely to serve all three jobs equally well.

A paper globe stands beside curling unlabelled map sheets
A conceptual paper study, rather than an exact projection comparison.

That is the practical heart of map projections. A projection turns positions on a curved reference surface into positions on a plane. It must make compromises, but the useful question is more specific than “Which map is wrong?” Ask which relationships the map is designed to preserve, where it preserves them, and whether those relationships match the question you brought.

Job one: compare area

If area is the task, choose a suitable equal-area projection. Equal-area does not mean familiar shapes, true distances everywhere, or perfectly preserved local angles. It means the map’s area relationships have a particular mathematical fidelity to the reference surface.

Imagine two equal patches on a sphere, one near the equator and one at sixty degrees north. On an equator-normalized spherical Mercator map, the local linear scale at sixty degrees is twice the equatorial scale. Area is scaled in two directions, so a sufficiently small patch there occupies about four times the map area it would at the equator. This is an original calculation from the spherical scale relationship, not an area estimate for any country.

The numerical distinction explains why a map can make high-latitude regions visually dominant. The lines may look calm and regular while the space between them carries a large distortion. A rectangular outline does not guarantee an impartial comparison of land area.

A latitude changes the scale

Compare ideal spherical Mercator and Lambert cylindrical equal-area local scale factors.

Open a latitude changes the scale in its own window.

The comparison tool uses ideal spherical formulas and a latitude control. It shows the different behavior of Mercator and Lambert cylindrical equal-area, with the equator as the true-scale parallel. It does not draw borders, estimate national areas, or model Earth as an exact ellipsoid.

Job two: follow a constant heading

The PROJ Mercator documentation explains why a rhumb line, or constant-heading route, becomes a straight line on this projection. That is a useful navigational property. It is different from saying that every straight segment on a Mercator map is the shortest route over the globe.

On a sphere, a shortest surface route follows a great circle, with qualifications for antipodal ambiguity. Except for special cases, a constant compass heading and a shortest route are different curves. A map can make one convenient to draw without making it equivalent to the other.

Consider a reader planning a route from a screen image. A straight ruler line can look definitive. Before interpreting it, the reader needs to know what sort of line that projection turns straight. The same visual gesture can represent different geographical relationships on different maps.

Job three: measure distance from a center

An equidistant projection preserves particular distances, not every possible distance between every pair of points. For an azimuthal equidistant map centered on one city, radial distances from that center are the intended preserved relationship. Measuring between two other cities is a different question.

The USGS explanation stresses both purpose and geographical extent. A projection that distorts a whole-world view severely may work very well over a carefully chosen smaller region. “Mercator” and “Transverse Mercator” also describe different orientations, and their useful regions differ.

Try a map-reading challenge with no numbers. If a map is centered on your home and circles mark equal distances from that home, which claim should you trust first: how far a destination lies from you, or the distance between two destinations on opposite sides of the map? The radial design gives you a reason to favor the first question.

A partly opened orange peel curls beside the remaining orange
A physical analogy for the difficulty of flattening a curved surface.

The orange-peel analogy, used carefully

A peel helps make curvature tangible. Open it and pieces lift, split, or refuse to lie flat without changing their relationship. A map projection does not have to imitate the physical act of squashing a peel: it can be defined directly by equations. But the analogy is a useful reminder that a round surface and a plane have different geometry.

Some world maps use interruptions, rather like selected cuts, to control distortion in areas of interest. Others retain a continuous rectangle and accept a different pattern of stretching. Neither choice can be judged by appearance alone. A continuous ocean may be crucial to one story; uninterrupted land areas may be more useful to another.

Read the small print before reading the world

First identify the projection and reference surface if they are given. Then ask whether the map covers a neighborhood, a country, a hemisphere, or the whole planet. Distortion that is negligible for one extent can become the dominant feature at another.

Next distinguish projection from presentation. The choice of central meridian, cropping, orientation, colors, and labels can shape attention without changing the underlying projection family. North at the top is a familiar convention, not a geometric requirement for the Earth.

Finally inspect what the map asks you to compare. A choropleth coloring regions by a percentage communicates a different quantity from symbols scaled by total count. Even a well-chosen equal-area projection does not rescue an unclear legend or a misleading statistical denominator.

Snyder’s USGS working manual is a route into the full mathematics and use cases. The PROJ equal-area cylindrical reference also shows how choosing different true-scale parallels produces named variants within a family. Projection names are starting points for questions, not a complete statement of every parameter.

The reward for learning these distinctions is not distrust of every map. It is the ability to choose and read one with a purpose. A map becomes more useful when its compromises are visible enough that you know which questions it can answer well.

Follow the evidence: USGS: choosing map projections; USGS: Snyder’s working manual; PROJ: Mercator; PROJ: equal-area cylindrical.

Explore all 80 new articles · Browse the complete illustrated collection

Explore more art, ideas, experiments, and independent projects at Incoprea.

The Keyboard That Writes in Chords

A court reporter’s keyboard can look as if someone removed most of the alphabet. There are few keys, some letters appear twice, and the hands do not move through ordinary words one character at a time. The apparent shortage is the point. A stenotype machine treats a group of simultaneous key presses as a meaningful unit.

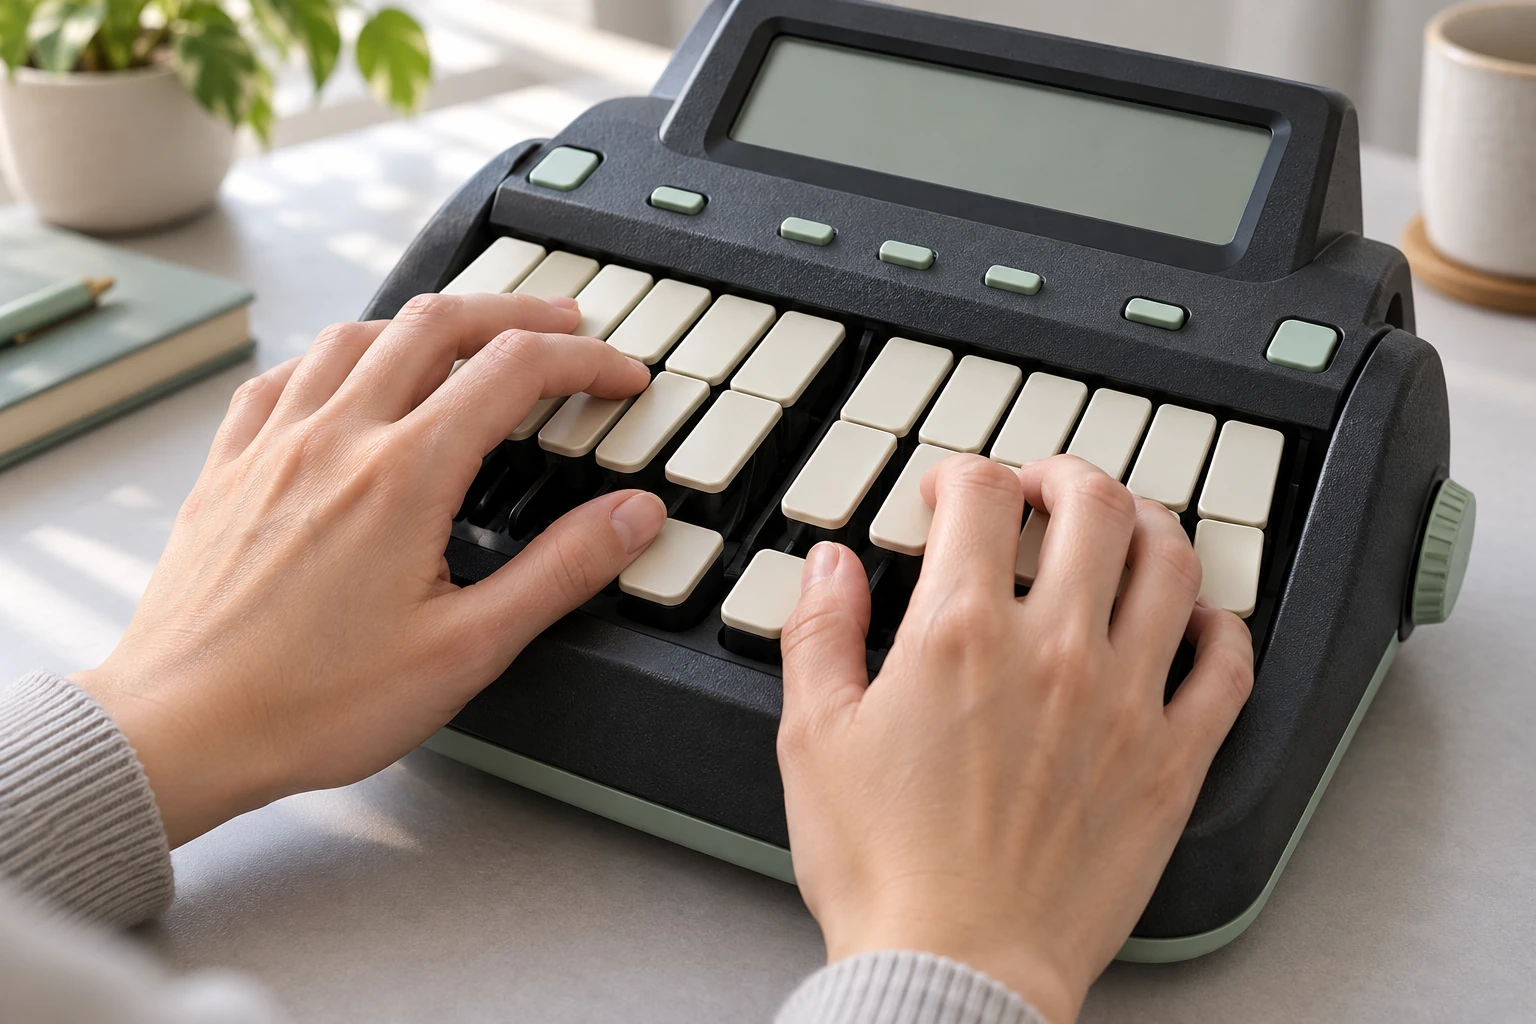
Hands rest on a compact unbranded stenotype machine with blank keys
An illustrative machine; actual key layouts and learned theories should be read in the linked guides.

Try a harmless analogy on your desk. Tap three fingers separately, then tap the same three together. The second gesture can be recognized as one pattern even though it contains several contacts. Machine shorthand builds a practiced language around such patterns. The skill lies in mapping heard speech into learned strokes, not simply moving each finger faster.

Read the chord across the word

On a conventional English-language steno layout, beginning consonants occupy the left, vowels sit near the thumbs, and ending consonants occupy the right. Combinations stand for sounds that do not have individual keys. A chord can represent a syllable, a word, or a familiar phrase, depending on the theory and dictionary.

The Stenograph Wave guide explains this sound-based organization and provides examples. It describes a two-stroke route through “courthouse” and also shows how a phrase can be compressed into a single learned outline. The guide is a primary explanation of one machine and its system, not a promise that every theory writes every word the same way.

Think about why duplicate letters can be useful. A consonant at the start of a syllable has a different position in the pattern from one at the end. The layout helps distinguish those roles spatially. It does not need a separate full alphabet for each role because combinations supply additional sounds.

The dictionary is part of the instrument

The machine captures strokes. Translation software interprets them using a dictionary that maps stroke sequences to text or actions. A single stroke may have one entry; a sequence may match a longer entry. Plover’s dictionary documentation makes that mapping explicit in a form you can inspect.

This is not ordinary autocorrect guessing a complete sentence from a few approximate letters. The stenographer learns a systematic representation, and the dictionary gives those outlines their translations. Personal briefs, specialized vocabulary, punctuation strokes, and conflict resolution all matter to useful output.

Imagine two shorthand users who hear the same sentence but have learned different briefs. Their finger movements need not be identical. Both may produce the same text through distinct trained mappings. The visible machine is only part of the writing system; the learned theory and the translator’s dictionary carry a great deal of its structure.

Three different kinds of speed

First there is physical stroke rate: how often the hands make a new chord. Then there is informational efficiency: how much speech each chord represents. Finally there is accurate, usable output after translation and review. Collapsing these into one impressive words-per-minute number hides what is actually being tested.

As checked for this article, NCRA’s Registered Professional Reporter page lists five-minute skills components at 180 words per minute for literary material, 200 for jury charge, and 225 for testimony/Q&A. Each requires 95 percent accuracy under its specified test process. These are certification requirements, not a claim that a novice becomes accurate at that speed by buying a machine.

They are also not the same as an unedited real-time stream. Time for transcription and the rules of a particular test affect what a result means. Whenever you see a shorthand speed record or a demonstration, ask whether the number refers to captured notes, live translation, or a final corrected transcript.

A five-minute visit to a different keyboard

The Open Steno Project offers an in-browser demonstration and learning material. You can explore the premise before installing software or purchasing equipment. Treat the first visit as an observation exercise rather than a typing competition.

  1. Look at the left, vowel, and right groups. Identify the direction in which an outline is read.
  2. Follow one supplied beginner example slowly. Notice which contacts belong to the same stroke.
  3. Release the chord and inspect the result. The release boundary helps distinguish one stroke from the next.
  4. Repeat the same example before choosing another. You are learning a gesture-to-unit relationship, not hunting for isolated letters.
  5. Compare the raw outline with its translated text. Ask which information belongs to the stroke and which comes from the dictionary.

A normal keyboard may not register every simultaneous combination because of its rollover behavior. A failed chord can therefore be a hardware limitation rather than an immediate failure of coordination. The project’s beginner resources explain compatible approaches. The important first discovery is conceptual: several keys can serve as one input event.

The human work continues after the chord

Speech arrives with names, interruptions, accents, ambiguity, and changing context. A writing system can compress familiar patterns, but it does not remove the need to listen and resolve meaning. The reporter’s practiced judgment includes knowing when a plausible translation is not the correct record.

That makes stenography a useful counterexample to the idea that fast work is always the same task performed at greater speed. Sometimes the task is reorganized into larger units. A pianist does not build every chord by consciously naming each key in sequence; a stenographer similarly develops coordinated patterns that can carry more than an isolated letter.

The tiny keyboard looks less strange once you see those units. It is not missing most of the language. It is asking the hands to reach language by a different route: sound, chord, learned outline, translation, and careful human checking.

Follow the evidence: Stenograph: Wave user guide, chapter two; NCRA: Registered Professional Reporter; Open Steno Project; Plover: dictionary formats.

Explore all 80 new articles · Browse the complete illustrated collection

Explore more art, ideas, experiments, and independent projects at Incoprea.

Fram: The Ship Built to Let the Ice Lift It

The usual answer to moving ice is to get away from it. Fram was built around a different intention: enter the pack, remain there, and survive long enough to be carried through an Arctic drift. The ship had to make confinement into a working condition.

An interpretive side view of the wooden polar ship Fram at rest in Arctic pack ice, three masts and a robust rounded hull, small scale against low blue-white pressure ice and a dim pale sky.
Fram was designed for prolonged work in moving ice. This interpretive scene represents the design problem rather than a documented expedition moment.

Its unusual shape was not an isolated flash of inspiration. The Fram Museum's ship history describes close collaboration among Fridtjof Nansen, Otto Sverdrup, and the builder Colin Archer. Launched in 1892 at Larvik, Fram combined a broad, rounded hull with heavy construction and arrangements for prolonged life aboard.

Look at the direction a force is allowed to act

The design aim was to let pressure from the ice push the vessel upward instead of gripping and crushing a more conventional hull. The rounded cross-section was part of that aim. It makes more sense when understood as a relationship between shape and contact, rather than as a magical property of exceptionally thick wood.

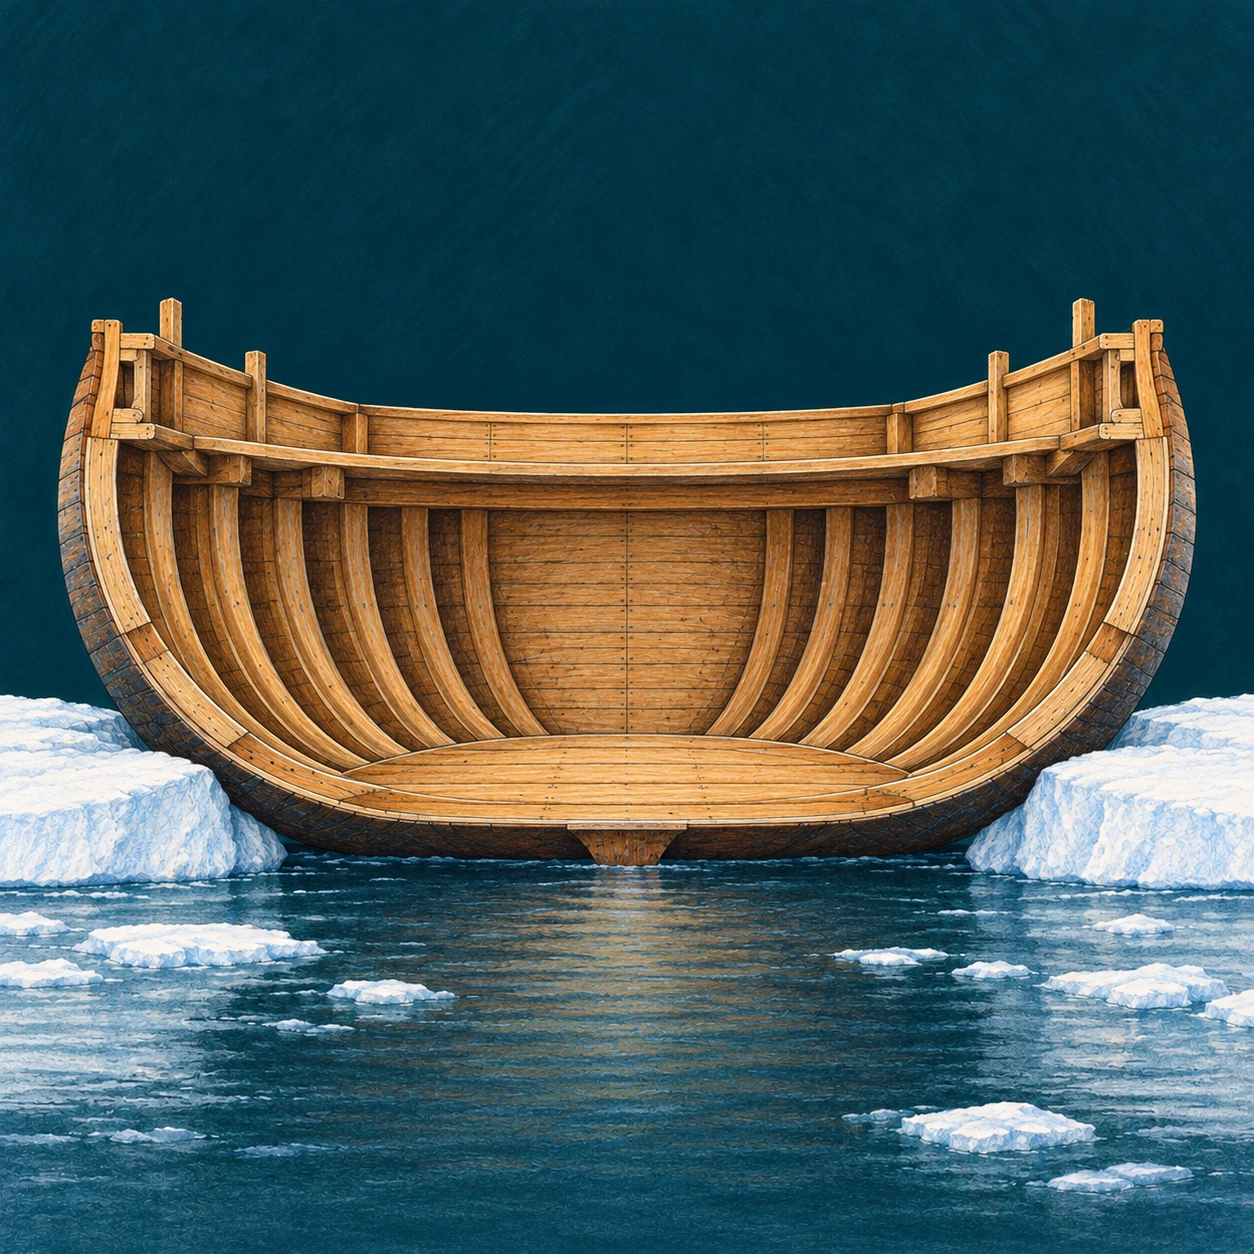
A simplified cross-section of a stout wooden polar ship inspired by Fram, showing a wide rounded exterior hull, many thick timber ribs and a clear inward-sloping lower hull; it sits between two low white ice slabs which touch the sides.
The rounded section is a simplified design study. It is not a measured Fram shipyard drawing or a calculation of ice loads.

The enlarged section above is a qualitative study. It shows a broad hull between simplified ice blocks, without supplying timber dimensions or calculated loads. Real ice does not press as a neat pair of identical blocks, and no small diagram can establish how a ship responds to every combination of pressure, cracking, friction, and motion.

A useful comparison is to ask what a shape encourages, not what it guarantees. An inward-sloping contact surface may help convert sideways pressure into upward movement. Strength is still necessary. So are details that protect vulnerable components and a plan for living with conditions that cannot be commanded.

A good answer in ice can be an uncomfortable answer at sea

The museum's technical account notes a consequence of Fram's broad proportions: uncomfortable rolling in open water. That is an unusually useful detail because it prevents the design from turning into a simple story of perfect engineering. A feature can improve performance in one setting while imposing a cost in another.

Before you admire any specialized machine, make a list of the conditions it was built to face. Then ask which conditions have been left off the list. Speed, steering, comfort, draft, cargo, endurance, and survival may compete. A sensible design is a set of choices among those demands, not the winner of a single abstract contest.

Fram also needed to function as an inhabited space. Research and daily routines had to continue during a journey whose timing was uncertain. The hull's survival and the crew's ability to live aboard were related problems. A ship that remains afloat but cannot support its occupants has not solved the expedition's whole task.

Drifting did not mean moving straight toward the goal

The museum's Nansen account describes the 1893 departure and the deliberate entry into the pack. It also describes drift that sometimes carried the ship north and sometimes south. The plan depended on a large natural movement without allowing the crew to steer each day's progress.

This distinction is central to understanding the expedition as an experiment. The investigators could choose equipment, provisions, observations, and an initial strategy. They could not turn the Arctic into a conveyor belt with a guaranteed schedule. The uncertainty was not a decorative adventure element added afterward; it was built into the method.

Read a polar ship as a set of linked requirements
RequirementQuestion to ask of the evidence
Survive ice pressureWhich features concern shape, and which concern strength?
Travel in open waterWhat compromises appear in handling or comfort?
Remain inhabitedWhere are storage, insulation, work, and living arrangements?
Serve another expeditionWhich parts were altered between journeys?

The preserved ship is also a record of revision

The museum's exhibition account explains that Fram was modified for successive expeditions and is presented in the configuration associated with Sverdrup's second voyage. A preserved vessel is therefore not automatically an untouched snapshot of its first departure.

That later history adds value. Repairs and alterations show how experience changed the working object. Fram's story is strongest when it includes revision, discomfort, and uncertain movement alongside the rounded hull. The remarkable achievement was not a ship that abolished the Arctic's demands. It was a carefully developed way to keep working within them.

Sources and further exploration

Explore all 80 new articles · Browse the complete illustrated collection

Continue exploring art, ideas, and unexpected connections at Incoprea.

Thursday, October 22, 2026

The Zipper Slider Is a Tiny Traffic Junction

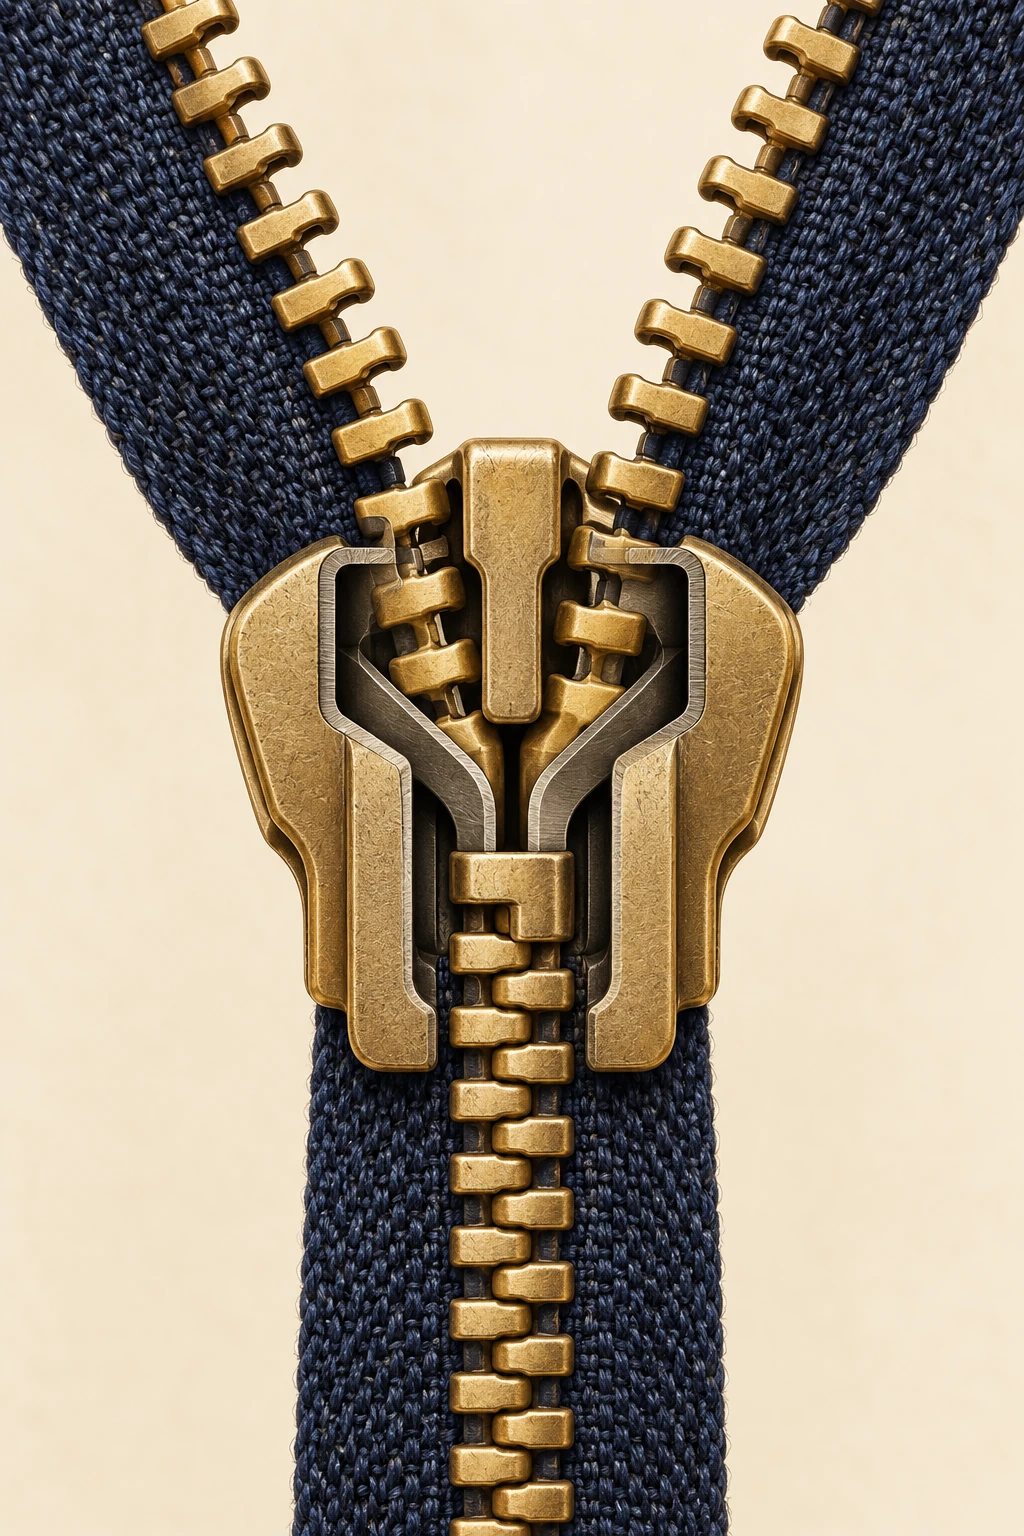
A zipper asks your hand to make one simple movement while it quietly organizes hundreds of smaller ones. Pull upward on a jacket and two ragged edges become a reliable seam. The teeth do not individually know where to go. Their route has already been built into the small metal body under your fingers.

Conceptual cutaway of a brass zipper slider between separate and engaged rows on indigo cloth.
Conceptual cutaway. The internal arrangement is simplified; it is not a manufacturer drawing or a repair diagram.

The most useful way to inspect a zipper is to stop looking at its pull tab. The tab is a handle. The actual machine is the slider beneath it: a compact guide that brings two rows together or separates one joined chain. Once you recognize that distinction, a familiar object becomes a miniature lesson in directing movement.

Follow one tooth through the junction

YKK's cutaway explanation identifies a Y-shaped channel inside the slider. In the closing direction, the two branches lead separate rows toward a common exit. The guide constrains the position of successive elements so their shaped surfaces engage. Reverse the motion and a divider leads the joined rows apart again.

Imagine marking one tooth with a removable paper pointer beside the fabric. As the slider passes it, the tooth is guided sideways into an engagement with its neighbors. Then the slider moves on. The tooth stays in the seam; it does not travel the length of the garment with the handle. You are moving the location where joining happens, rather than carrying the whole chain through a stationary machine.

That distinction is easy to miss because our attention follows the moving handle. Try describing the action without using the word “pull”: a traveling guide successively changes the arrangement of parts fixed to flexible edges. The longer description reveals why a short slider can organize a long closure.

The useful part can be the gap

A successful fastening is not necessarily an arrangement in which every surface presses tightly against its neighbor. A working zipper needs enough freedom for the elements to move through the guide and for the finished seam to bend.

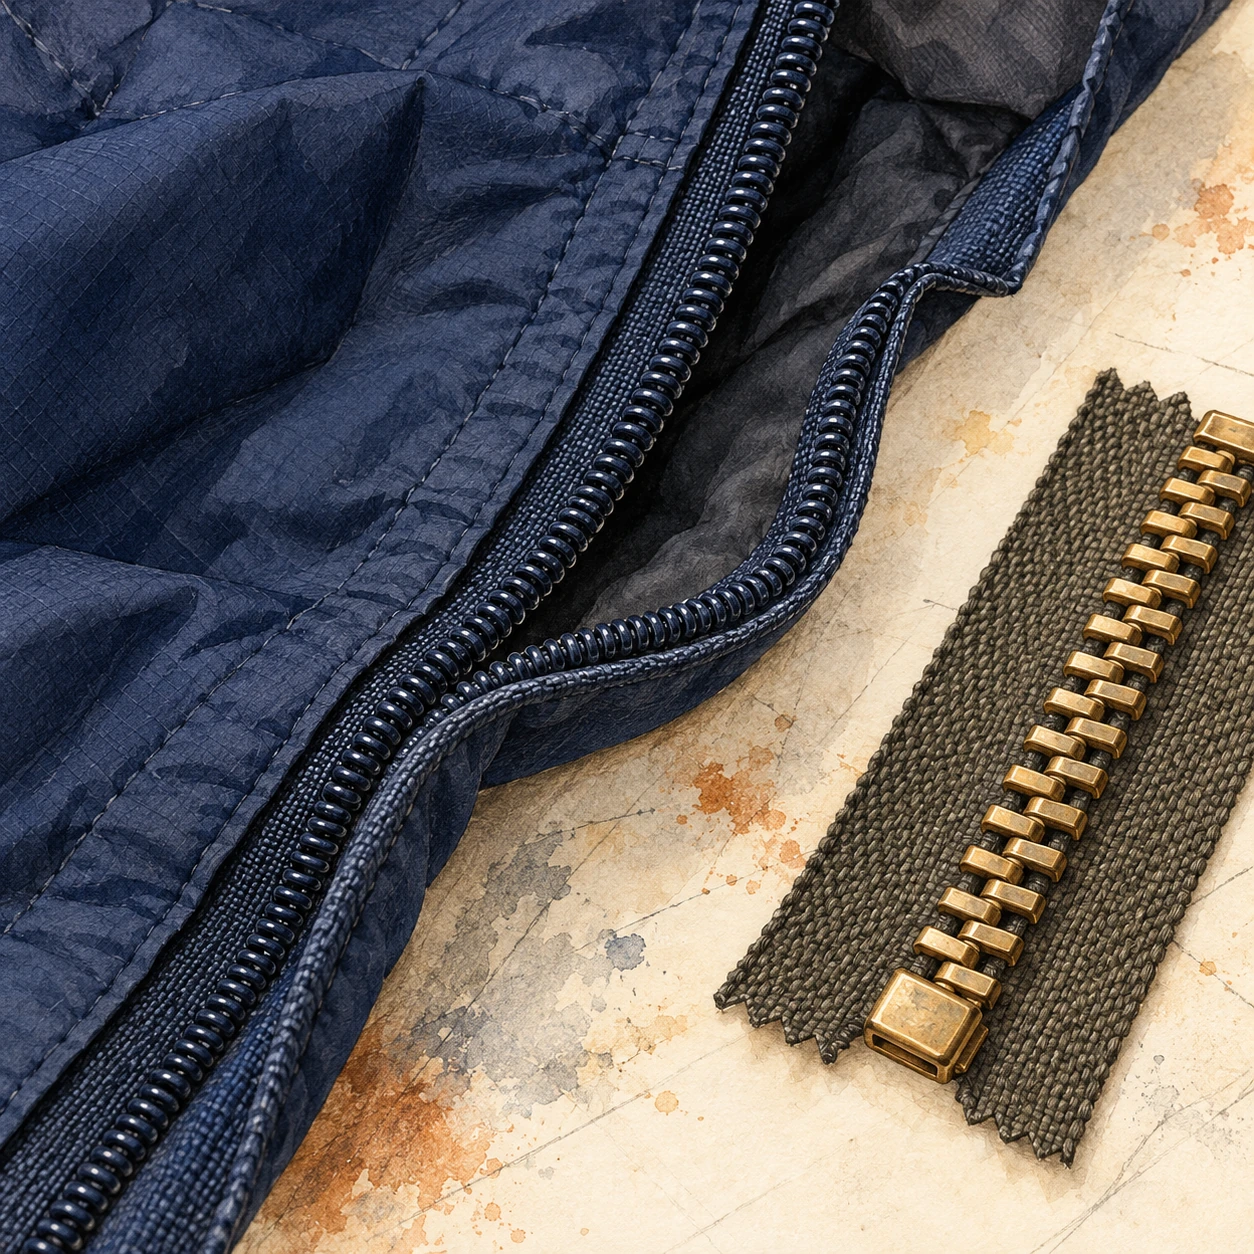
Partly open dark fabric zipper beside a small metal-tooth zipper sample on a pale work surface.
Material study of two fastening constructions; it is not an internal drawing or a repair specification.

YKK's account of element spacing makes that compromise explicit. Gaps that are too large can permit misalignment; gaps that are too small make operation stiff. The empty intervals are designed parts of the closure, even though they are less conspicuous than the teeth.

The same page distinguishes repeated opening-and-closing tests under load from a lateral test that pulls a chain to failure. These ask different questions. Surviving one large sideways pull would not, by itself, establish how smoothly a closure works after many cycles. A durable product needs a history of operation as well as resistance to an extreme event.

There is an older version of the flexibility problem in Gideon Sundback's patent published in March 1917. Its interlocking members have projections and recesses that fit together while permitting relative rocking. The text also emphasizes making the members alike on both sides, connecting the fastening geometry to how the parts could be manufactured. This is one historical design, rather than a drawing of every modern coil or molded zipper.

Read a patent as a sequence of questions

Open its drawings and find one member before tracing the entire chain. Where is that member fixed to the fabric? Which surface engages another member? Which movement must be permitted for the seam to bend, and which movement must be resisted to keep it closed?

Then compare the two modern material samples in the illustration. Treat them as prompts to inspect a real closure, not as a technical drawing. A continuous coil and a row of separate metal elements can share the broad task while achieving it through different constructions.

The revealing question is no longer simply whether a zipper is tight. It is where the design allows movement, where it restricts movement, and how consistently that division survives use. The little traffic junction works because its passengers have carefully chosen room to maneuver.

The seam has three cooperating materials

The manufacturer's basic parts guide groups a zipper into elements, slider and textile tape. Those parts divide the labor. The elements provide repeatable engagement; the slider supplies the route; the tapes connect a precise chain to a much larger, flexible object.

It is tempting to dismiss the tape as ordinary backing. But YKK's description of its woven tape shows different zones for different jobs. The edge supporting the elements has a cord-like structure. A denser region withstands contact with the slider. Another region supports sewing into the finished garment.

This makes the zipper a useful counterexample to the idea that good engineering always replaces soft material with hard material. A jacket needs both. If the entire closure were rigid, it could not comfortably follow the fabric. If every part behaved like loose cloth, the slider would have no dependable sequence of elements to engage. The useful behavior comes from arranging unlike properties next to one another.

A second mechanism decides when movement is allowed

Guiding the teeth and preventing unwanted slider movement are separate tasks. YKK illustrates locking sliders with small pins that engage the elements. In a pin-lock example, lifting the tab releases the pin. In an automatic-lock design, a gentle pull operates a spring-related mechanism. The exact movement depends on the slider type.

Watch how that changes the role of the tab. It can communicate an intention to move as well as transmit force. A lock lets the closure remain where it was left, while the same hand movement that starts opening also releases the restraint. A part that looks like decoration may therefore be linked to another action hidden inside the body.

This is why a single confident repair trick cannot fit every zipper. A closure that separates behind the slider, one that will not move, and one whose insertion pin is damaged present different symptoms. The visible problem identifies a question, not an automatic diagnosis.

Why harder pulling is often the wrong experiment

The manufacturer's care guidance warns that forcing a reluctant slider can damage the elements. Before applying any product-specific remedy, release tension on the fabric and inspect for caught lining or an obvious obstruction. Follow the garment and zipper maker's care instructions; delicate fabrics and coated closures may need different treatment.

The usage manual adds another useful complication: the finished garment changes the operating conditions. Sewing, laundering, material compatibility and the open-end components can all affect performance. A zipper is tested as a mechanism, but it is used as part of something else.

Next time you close a bag, pause halfway. Above the slider are two possibilities; below it is one joined edge. The machine at the meeting point is small because the work is sequential. Its success lies in making the same controlled event happen again and again, while your hand experiences only one continuous motion.

Sources and a closer look: YKK: the Y-shaped slider channel; YKK: the three basic parts; YKK: the woven tape; YKK: locking sliders; YKK Americas: care and slider questions; YKK usage instruction manual.

Explore art, experiments and other unexpected connections at Incoprea.

The QR Code Can Lose Pieces and Still Speak

A coffee stain can cover part of a QR code and the phone may still read it. That small success hides two different problems. First the reader has to find and geometrically interpret a square in a messy view. Then it has to recover a message whose visible marks may contain mistakes. A code that solves only the second problem might still be unreadable.

A deliberately nonfunctional code-like matrix with torn patches and conceptual reconstruction tiles.
Conceptual artwork, not a scannable QR code or a demonstration of a particular correction threshold.

The extra information is not merely the same web address printed repeatedly. The message is encoded with mathematical redundancy: relationships among codewords that allow a decoder to detect and correct certain errors. A codeword is a group of bits, not one black square. The distinction matters whenever someone claims a logo can safely cover a particular fraction of an image.

What the familiar percentage actually describes

DENSO WAVE's error-correction explanation identifies Reed–Solomon coding and four levels of protection. The commonly quoted approximate restoration levels—L 7%, M 15%, Q 25% and H 30%—refer to total codewords, not a guarantee that any matching percentage of the printed area can be erased.

Where damage lands matters. So do the geometry and the pattern that a reader must locate before decoding. A rectangle over a critical locating feature is not equivalent to the same number of damaged data modules spread elsewhere. Error correction is a designed capacity within a reading system; it does not make that system indifferent to its input.

Here is a separate, much simpler analogy. Write three numbers and a check total: 4, 7, 2; total 13. If one number is known to be missing, subtracting the other two from 13 recovers it. But if a number is merely wrong and you do not know which one, that single check does not identify the problem. Real error-correcting codes use more powerful relationships. The example shows why detecting a mismatch, locating an error and rebuilding a value are different achievements.

One more relationship can reveal where a change occurred

The earlier three-number example can recover a known missing value. Extend it with a second relationship and it can do something more interesting under a tightly stated assumption: identify one changed slot.

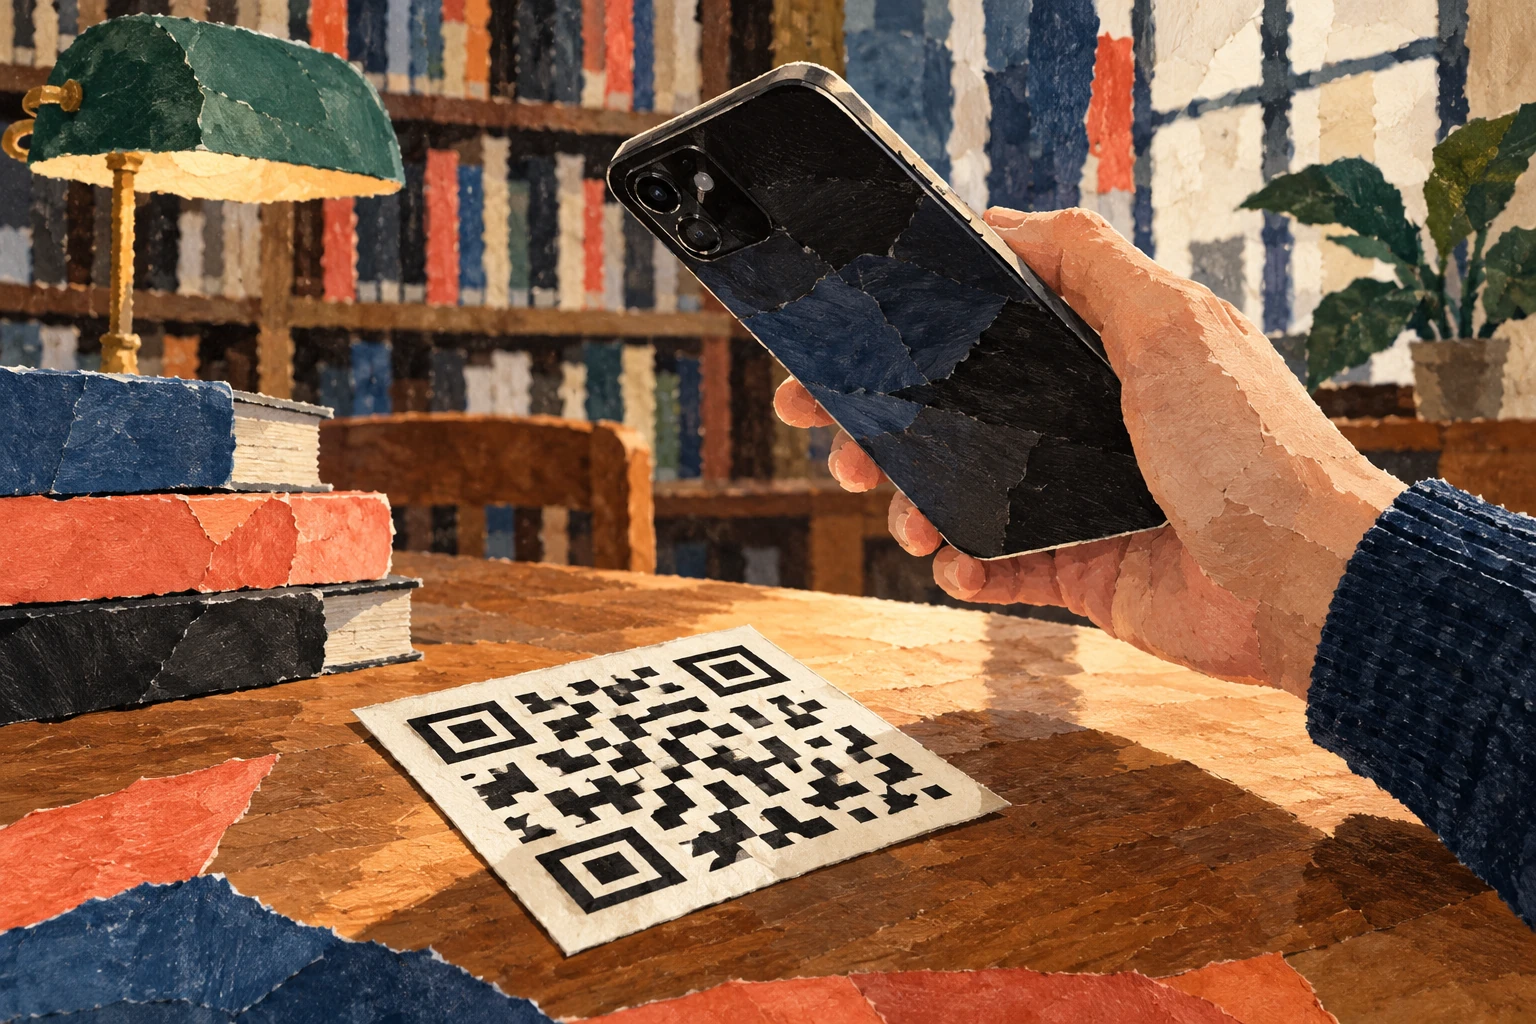
Phone held above a tilted abstract black-and-white matrix card on a library table.
The matrix is deliberately nonfunctional. It illustrates the reading task and contains no test message.

Keep the original values 4, 7 and 2. Their ordinary total is 13. Also store a weighted total: once the first value, twice the second, three times the third. That gives 4 + 14 + 6 = 24. The position of each number now affects one check differently.

Suppose the received values are 4, 9 and 2. The ordinary total has increased by 2; the weighted total has increased by 4. If exactly one data value changed and the checks remained intact, the ratio of those changes identifies the position: 4 ÷ 2 = 2. The second slot increased by 2, so its corrected value is 7.

This is an original ordinary-number puzzle, not the mathematics used inside a QR code. DENSO WAVE's explanation identifies byte-level Reed–Solomon coding, and William Geisel's NASA tutorial develops the field arithmetic and error-location machinery needed for that real system. The simple puzzle lets you encounter the job of an additional relationship without pretending to implement it.

Find a changed number with two checks

Print-friendly arithmetic puzzle with a single-error solution and a multiple-error counterexample.

Open this activity in its own window.

The assumption is part of the solution

The worksheet includes a second received message in which two values changed. Applying the single-error shortcut then produces a confident correction that satisfies both checks but recovers the wrong original message. Try it before opening the explanation.

That failure is useful. It shows why a correction method must be judged within its designed error capacity. A decoder is not making a philosophical promise that every plausible message is the intended one. It is using a particular code, a set of relationships and limits on the damage it can resolve.

Bring this distinction back to the stained square. Locating the symbol, identifying errors and reconstructing data are cooperating tasks with different assumptions. A successful scan feels immediate because those stages are hidden. Slowing down one tiny arithmetic version makes the hidden work much easier to appreciate.

The square has to announce itself first

In the developer's history, Masahiro Hara's team focused on finding a symbol quickly, rather than maximizing capacity alone. The prominent position patterns were designed to be distinguishable from surrounding printed matter. Their black-and-white run ratio helps the reader recognize a candidate code at different orientations.

That design choice gives a useful lesson for people making posters: the parts that seem like decorative framing are doing work. Treating the three conspicuous corner patterns as spare space misunderstands their job. A human may still recognize “something QR-like” after an alteration, while the decoder has lost the geometry it needs.

The empty space outside the code also counts. The official layout guide specifies a clear quiet zone four modules wide on every side for a standard QR code. The white border is part of the reading conditions, even though it contains none of the message.

More protection has a cost

The official version guide explains that a symbol's capacity depends on its version, character mode and correction level. Version 1 has 21 modules per side; subsequent versions add four per side, up to Version 40 at 177. Increased protection uses capacity that could otherwise hold message data. For a fixed message, the needed version can therefore increase.

Imagine two posters with the same physical square size. If one symbol needs more modules, each module becomes smaller. The extra mathematical protection may be useful, but printing and focusing now have a more demanding pattern to resolve. “Choose the highest level” cannot replace checking the finished print under intended conditions.

You can do a layout calculation without a phone. Suppose a chosen symbol has 29 modules per side and you allot 0.5 millimeters to each module. Its patterned square is 14.5 millimeters wide. Including four quiet-zone modules on each edge adds eight modules, so the total allocation is 37 × 0.5 = 18.5 millimeters. That is a geometry example, not a recommended minimum size for every application.

A successful read is only the first success

A QR code may contain a web address. Recovering the characters does not demonstrate that the destination still exists, that a redirect is dependable, or that the page is useful on a phone. The printed symbol and the service behind it have different lifetimes. A good publication check follows the whole experience from paper to readable content.

This is the deeper reason the battered square is interesting. It joins recognition, geometry, error correction, manufacturing and a reader's task in one small object. Its resilience comes from anticipating imperfect conditions at several levels. The coffee stain is simply where that preparation becomes visible.

Sources and a closer look: DENSO WAVE: error correction; DENSO WAVE: development history; DENSO WAVE: quiet zone and print area; DENSO WAVE: versions and capacity.

Explore art, experiments and other unexpected connections at Incoprea.

Famous Last Meals is now in paperback — stories, history and 25 recipes

Famous Last Meals: Stories, History, and Recipes is now available in paperback on Amazon. The illustrated collection brings together 23 his...