You are given three jobs and one blank map. The first job is to compare how much land two regions contain. The second is to plot a constant compass course. The third is to measure how far several cities lie from one chosen center. A single familiar world map is unlikely to serve all three jobs equally well.
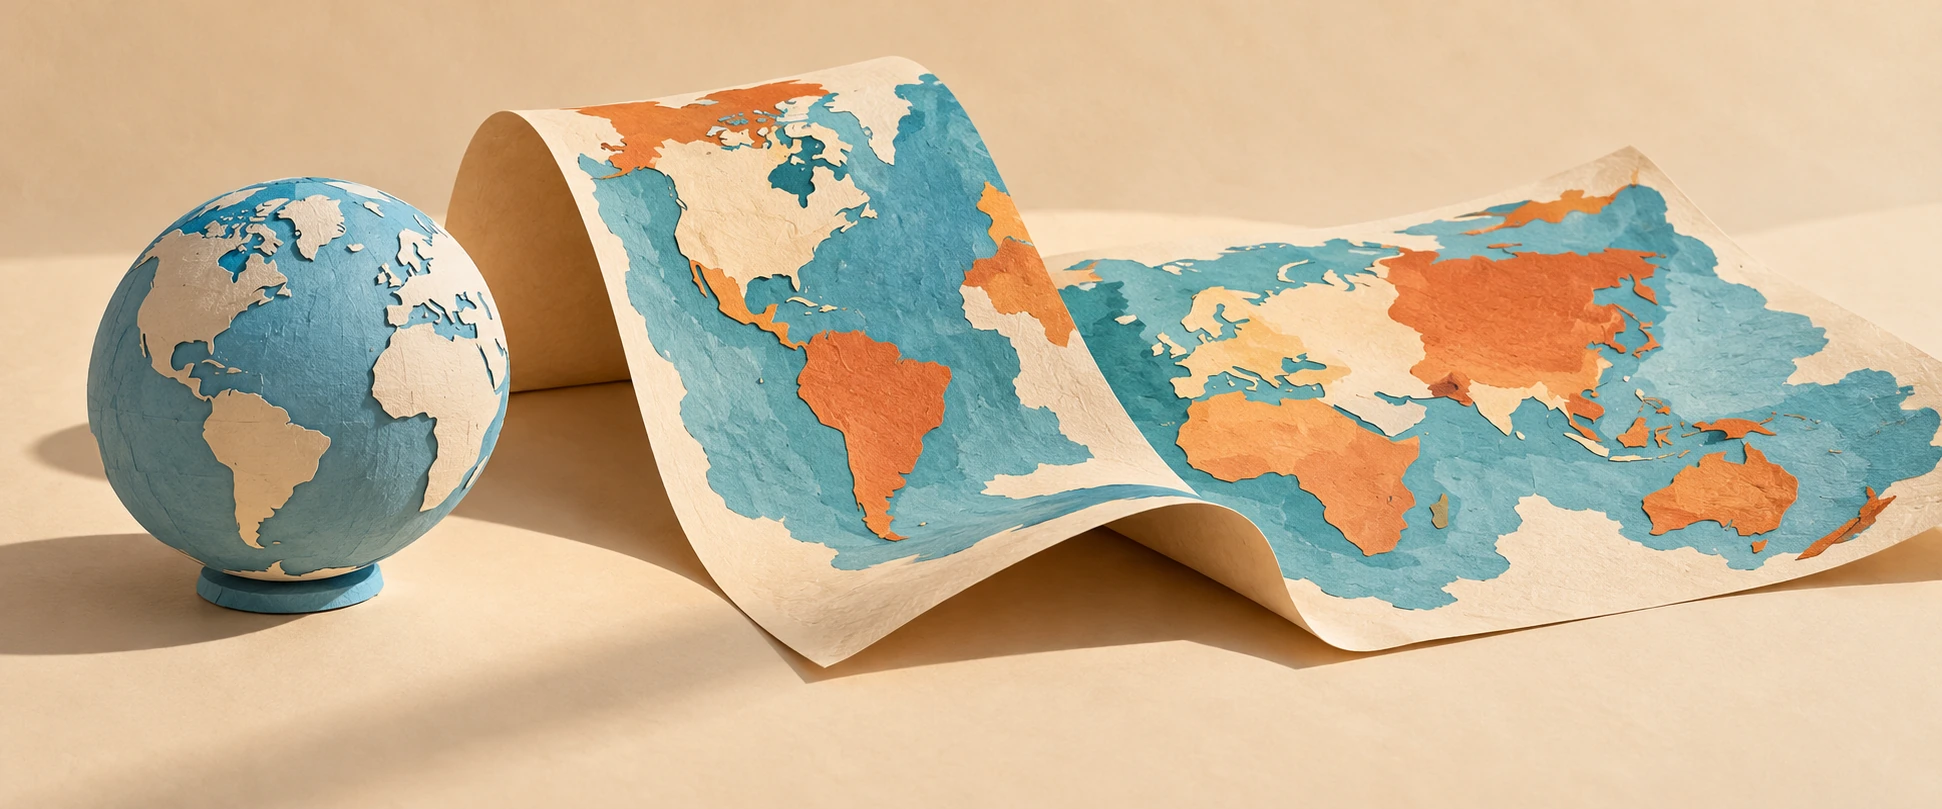
That is the practical heart of map projections. A projection turns positions on a curved reference surface into positions on a plane. It must make compromises, but the useful question is more specific than “Which map is wrong?” Ask which relationships the map is designed to preserve, where it preserves them, and whether those relationships match the question you brought.
Job one: compare area
If area is the task, choose a suitable equal-area projection. Equal-area does not mean familiar shapes, true distances everywhere, or perfectly preserved local angles. It means the map’s area relationships have a particular mathematical fidelity to the reference surface.
Imagine two equal patches on a sphere, one near the equator and one at sixty degrees north. On an equator-normalized spherical Mercator map, the local linear scale at sixty degrees is twice the equatorial scale. Area is scaled in two directions, so a sufficiently small patch there occupies about four times the map area it would at the equator. This is an original calculation from the spherical scale relationship, not an area estimate for any country.
The numerical distinction explains why a map can make high-latitude regions visually dominant. The lines may look calm and regular while the space between them carries a large distortion. A rectangular outline does not guarantee an impartial comparison of land area.
A latitude changes the scale
Compare ideal spherical Mercator and Lambert cylindrical equal-area local scale factors.
The comparison tool uses ideal spherical formulas and a latitude control. It shows the different behavior of Mercator and Lambert cylindrical equal-area, with the equator as the true-scale parallel. It does not draw borders, estimate national areas, or model Earth as an exact ellipsoid.
Job two: follow a constant heading
The PROJ Mercator documentation explains why a rhumb line, or constant-heading route, becomes a straight line on this projection. That is a useful navigational property. It is different from saying that every straight segment on a Mercator map is the shortest route over the globe.
On a sphere, a shortest surface route follows a great circle, with qualifications for antipodal ambiguity. Except for special cases, a constant compass heading and a shortest route are different curves. A map can make one convenient to draw without making it equivalent to the other.
Consider a reader planning a route from a screen image. A straight ruler line can look definitive. Before interpreting it, the reader needs to know what sort of line that projection turns straight. The same visual gesture can represent different geographical relationships on different maps.
Job three: measure distance from a center
An equidistant projection preserves particular distances, not every possible distance between every pair of points. For an azimuthal equidistant map centered on one city, radial distances from that center are the intended preserved relationship. Measuring between two other cities is a different question.
The USGS explanation stresses both purpose and geographical extent. A projection that distorts a whole-world view severely may work very well over a carefully chosen smaller region. “Mercator” and “Transverse Mercator” also describe different orientations, and their useful regions differ.
Try a map-reading challenge with no numbers. If a map is centered on your home and circles mark equal distances from that home, which claim should you trust first: how far a destination lies from you, or the distance between two destinations on opposite sides of the map? The radial design gives you a reason to favor the first question.

The orange-peel analogy, used carefully
A peel helps make curvature tangible. Open it and pieces lift, split, or refuse to lie flat without changing their relationship. A map projection does not have to imitate the physical act of squashing a peel: it can be defined directly by equations. But the analogy is a useful reminder that a round surface and a plane have different geometry.
Some world maps use interruptions, rather like selected cuts, to control distortion in areas of interest. Others retain a continuous rectangle and accept a different pattern of stretching. Neither choice can be judged by appearance alone. A continuous ocean may be crucial to one story; uninterrupted land areas may be more useful to another.
Read the small print before reading the world
First identify the projection and reference surface if they are given. Then ask whether the map covers a neighborhood, a country, a hemisphere, or the whole planet. Distortion that is negligible for one extent can become the dominant feature at another.
Next distinguish projection from presentation. The choice of central meridian, cropping, orientation, colors, and labels can shape attention without changing the underlying projection family. North at the top is a familiar convention, not a geometric requirement for the Earth.
Finally inspect what the map asks you to compare. A choropleth coloring regions by a percentage communicates a different quantity from symbols scaled by total count. Even a well-chosen equal-area projection does not rescue an unclear legend or a misleading statistical denominator.
Snyder’s USGS working manual is a route into the full mathematics and use cases. The PROJ equal-area cylindrical reference also shows how choosing different true-scale parallels produces named variants within a family. Projection names are starting points for questions, not a complete statement of every parameter.
The reward for learning these distinctions is not distrust of every map. It is the ability to choose and read one with a purpose. A map becomes more useful when its compromises are visible enough that you know which questions it can answer well.
Follow the evidence: USGS: choosing map projections; USGS: Snyder’s working manual; PROJ: Mercator; PROJ: equal-area cylindrical.
Explore all 80 new articles · Browse the complete illustrated collection
Explore more art, ideas, experiments, and independent projects at Incoprea.