Showing posts with label Magnetism. Show all posts

Thursday, October 22, 2026

The Laschamp Excursion: A Brief Detour in Earth’s Magnetic Field

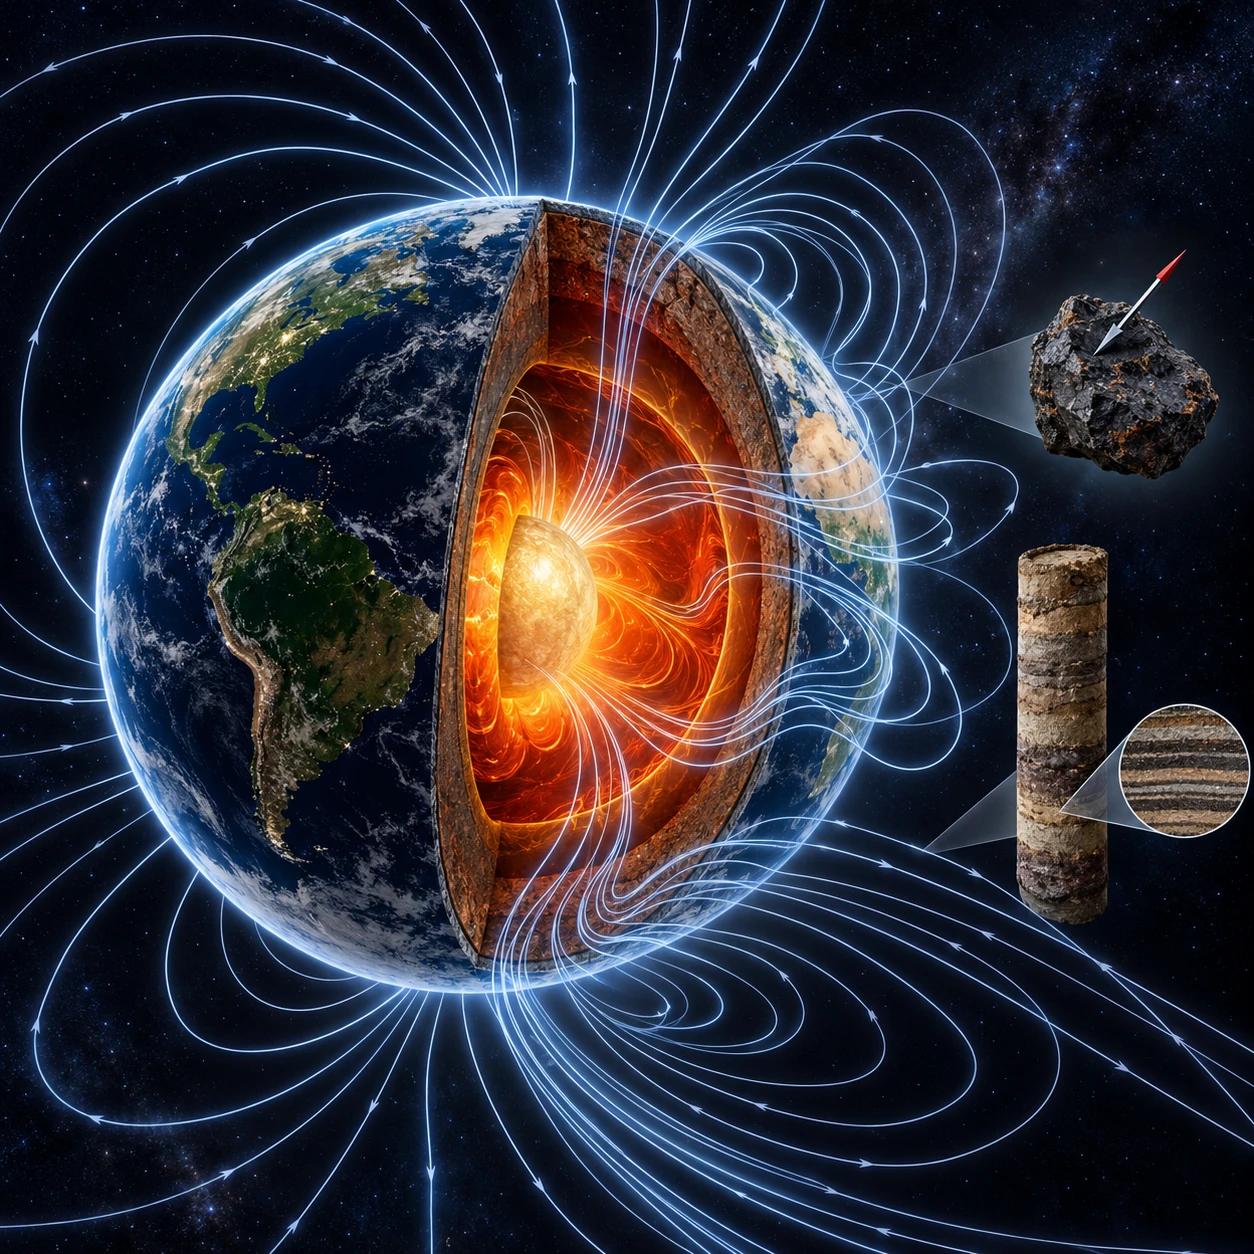
Conceptual Earth cutaway with asymmetric pale magnetic field lines, an oriented lava sample, and a layered sediment core.
AI-generated conceptual paleomagnetic artwork, not a reconstruction of the Laschamp field. Field lines, colors, and sample scales are illustrative.

About 41,000 years ago, Earth’s magnetic field made a brief departure from its usual configuration. The field weakened strongly and directions changed dramatically before returning to the preceding polarity. The event is known as the Laschamp excursion.

The planet did not turn upside down. Geographic north, Earth’s rotation axis, and the magnetic direction recorded by a rock are different things. The interesting story is how researchers reconstruct a changing invisible field from materials that recorded it in different ways.

A magnetic event, recorded indirectly

Cooling lava can preserve a remanent magnetization related to the field at the time it acquired that record. Sediments can also retain magnetic information, though deposition, alignment, compaction, chemical changes, and later disturbance complicate the recording process.

The USGS polarity-reversal guide explains the geological evidence for reversals and excursions. An excursion returns to the preceding polarity rather than establishing a long new polarity interval. The boundary between named categories is a description of the reconstructed behavior, not a physical switch labeled “excursion.”

Laschamp is especially useful because evidence appears in multiple archives and regions. A striking lava direction at one locality alone could be questioned as a local or recording effect. Agreement among independently studied records strengthens the case for a global field change.

Time resolution changes the apparent event

A lava flow may record a relatively limited interval of cooling. A sediment core offers a more continuous sequence, but the signal can be smoothed or shifted by the way magnetization becomes locked in. An ice core records other consequences through different physical and chemical processes.

A high-resolution marine-sediment study from the Blake-Bahama Outer Ridge discusses how archive properties affect reconstructed duration and direction. The event does not come with one universally visible start and end that every material records identically.

This is why it is better to report an approximate age here than to assign a single exact calendar year. Dating uncertainty, archive response, and the chosen definition of the excursion all contribute to the comparison.

Weakening the shield changes another archive

Earth’s magnetic field influences the access of charged cosmic particles to the atmosphere. Changes can affect production of cosmogenic isotopes such as beryllium-10 and radiocarbon. Those records offer evidence related to field intensity, while atmospheric transport and geochemical storage add their own filters.

Research using the EPICA Dome C ice core investigates a signal associated with the Laschamp interval and compares different kinds of evidence. A coincidence in two time series is useful, but its interpretation still depends on the processes linking each measurement to the field.

Field weakening is not identical to the field vanishing everywhere. Local directions and intensities can become complex when the global dipole contribution is reduced. A tidy bar-magnet drawing is least reliable precisely when the non-dipole structure becomes relatively important.

From scattered records to a global model

GFZ’s LSMOD models cover the interval around Laschamp and another excursion. They combine geographically distributed paleomagnetic information into a representation of field evolution, rather than simply joining a few magnetic poles on a map.

GFZ’s longer GGFSS 70 model provides another reconstruction covering several excursions. Differences in temporal smoothing, data coverage, and model choices can affect the details. A model animation is an interpretation constrained by observations, not footage of the ancient magnetic field.

Pay particular attention to regions with sparse data. A global globe must display something everywhere, but the observations do not constrain every place equally. Uncertainty should accompany the most dramatic-looking field-line pictures.

Three claims that require three evidence chains

Keep the inference ladder visible
ClaimEvidence needed
The field changed markedlyWell-dated magnetic records and coherent reconstruction
Atmospheric particle exposure changedField and production models plus cosmogenic archives
A specific ecological or human event resultedIndependent chronology, mechanism, magnitude, and alternatives

The first claim does not automatically prove the third. Broad stories about extinctions, human behavior, or climate require separate tests of timing and causality. A magnetic event can be well established while a proposed environmental consequence remains uncertain.

For a chronology exercise, draw three horizontal time axes for a lava sequence, a sediment core, and an ice core. Give each an uncertainty band instead of a perfectly sharp event line. Ask whether the bands overlap before deciding that two changes were simultaneous. Then allow one archive to smooth a short event into a broader feature. The exercise explains how a real shared signal can appear to have different durations, and how an apparently exact coincidence can weaken when dating uncertainty is restored.

Does this make the next reversal predictable?

The historical record does not reveal a regular reversal schedule. Present changes in field strength or a regional weak area do not by themselves establish that a global reversal is imminent.

A 2018 study comparing recent field behavior with past excursions illustrates how researchers test such analogies rather than extrapolating one declining trend indefinitely. Its conclusion belongs to the data and models considered, not to a universal guarantee about all future geomagnetic behavior.

A useful thought experiment is to compare two time series that both decline over a short interval. One later recovers; the other continues into a larger transition. The early segment alone may not distinguish them. More observations and a physical model are needed, and even then forecasting has limits.

Read the archive, not an apocalypse poster

Choose one published Laschamp figure and identify whether it shows direction, relative intensity, cosmogenic production, or a model-derived dipole moment. Then read its time axis and uncertainty. Those quantities are related but not interchangeable.

The excursion’s real achievement is that an invisible episode can be reconstructed at all. Lava, mud, and ice each preserve an imperfect part of the record. The deeper story appears when their imperfections are understood well enough to let them speak together.

Sources and a next step

Continue exploring art, ideas, and unexpected connections at Incoprea.

The South Atlantic Anomaly Is a Spacecraft Problem With a Deep-Earth Story

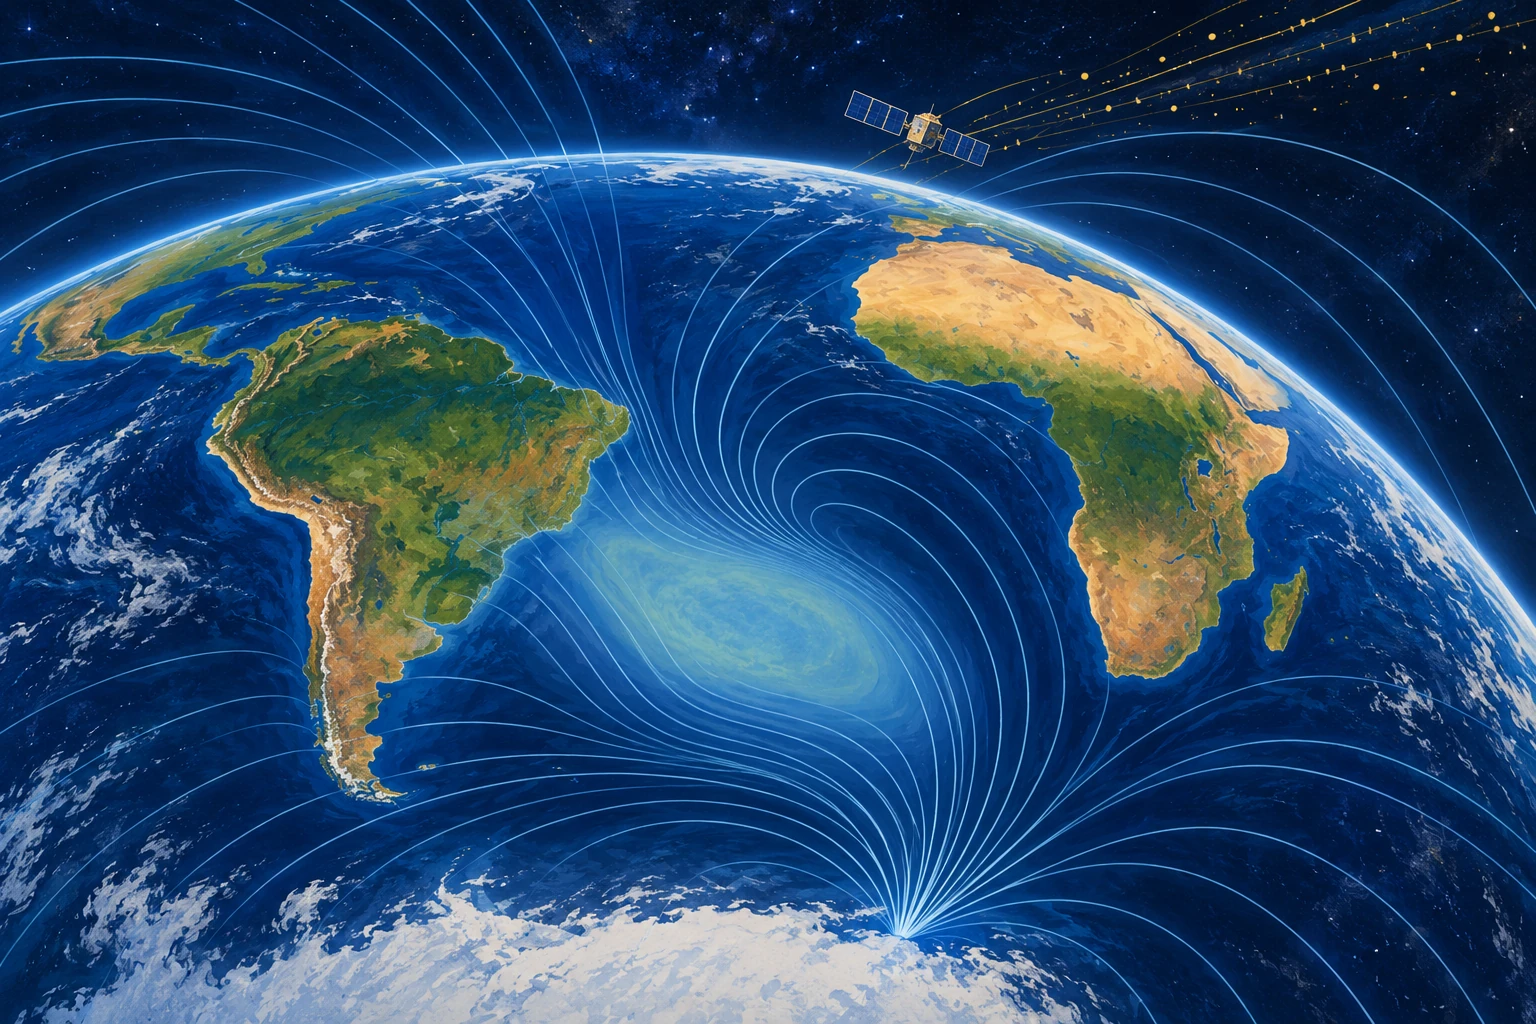
Conceptual Earth view centered on the South Atlantic with pale magnetic contours and a tiny satellite amid sparse particle dots.
AI-generated conceptual illustration of the South Atlantic Anomaly. The patch, field lines, and particles are schematic, not a radiation or magnetic-intensity map.

A spacecraft can cross the South Atlantic and encounter a radiation environment that differs markedly from another part of the same orbit. The region is associated with an unusually weak portion of Earth’s magnetic field: the South Atlantic Anomaly, or SAA.

Its name sounds like a mysterious hole. The reality is more specific and more useful. A changing, asymmetric magnetic field alters where trapped energetic particles can reach low orbital altitudes, creating an operational problem for instruments and a scientific clue to processes deep inside Earth.

There is no missing patch of planet

Earth’s field is largely generated by electrically conducting fluid motion in the outer core. It is neither perfectly centered nor a simple permanent bar magnet. Regional features ride on top of a broader dipole-like structure.

NASA’s account of the anomaly connects the weak-field region with the radiation conditions faced by satellites. The “dent” is a metaphor for field geometry and intensity, not a cavity in the atmosphere or a hole through which empty space pours.

Magnetic-field strength and particle flux are related but different quantities. A map of surface field intensity is not automatically a radiation-dose map for a spacecraft at a particular altitude. Orbit, particle energy, detector sensitivity, and time all matter.

The spacecraft consequence is concrete

Energetic particles can disturb electronics, create spurious detector events, degrade components, or interrupt observations. Operators may schedule protective actions or pause sensitive measurements during passages through a hazardous region.

NASA’s ROSAT material provides an example of the anomaly’s relevance to an astronomical mission. An observation gap can therefore reflect an instrument protecting its data or hardware, rather than an absence of interesting objects in the sky.

Imagine a telescope trying to count faint X-ray photons while charged-particle events increase its background. The problem is both reliability and interpretation: which detector signals came from the astronomical target, and which arose from the local environment?

A field that changes in more than one place

ESA’s October 2025 Swarm report describes changes observed between 2014 and 2025, including expansion of the weak-field area and differing behavior toward Africa and South America. The anomaly is not a rigid patch drifting intact across a map.

The report links the behavior to reverse-flux features near the core-mantle boundary. These are inferred aspects of the magnetic field at depth, constrained through observations and modeling. Nobody has placed a camera beside the outer core to film a magnetic patch.

The difference between model inference and direct view matters because a global field model combines several sources. Satellites measure contributions from the core, crust, oceans, ionosphere, and magnetosphere. Separating them requires careful treatment of location, time, and external activity.

What a satellite constellation adds

Multiple spacecraft and ground observatories help constrain spatial structure and temporal change. The CHAOS-7 model paper documents a field model built from several satellite missions and observatory data, then uses it to study the SAA and other changes.

A time sequence is especially valuable. A single map can show a weak region. A consistent series helps estimate how that region evolves and whether different parts behave differently. Data processing must still distinguish a real change from a change in sampling or model construction.

When comparing two published maps, check the altitude, field quantity, color limits, date, and contour threshold. If the colors are rescaled independently, a weak-looking area on one map may not be numerically comparable with the same shade on another.

Draw two maps that answer different questions

For a paper exercise, sketch a surface magnetic-intensity map and a spacecraft radiation-count map. Give each a separate legend. Now ask which map helps investigate the core and which helps an instrument operator plan a passage.

The answer is not exclusive—both can inform both tasks—but the measured quantities differ. Add a second orbit at a different height. Its detector need not record the same counts over the same ground location. This is why “over the anomaly” is incomplete without orbital context.

The exercise is conceptual, not a radiation model. It makes a common visual shortcut visible: a two-dimensional map can hide the three-dimensional environment through which a satellite actually moves.

A forecast is not a photograph from the future

Geomagnetic forecasts combine physical understanding, recent observations, and assumptions about evolution. A graphic that includes projected years should label the boundary between observations and forecast. Otherwise a viewer may treat a modeled future shape as a measurement already made.

That distinction also applies to popular animation. Smoothly moving colors interpolate between states; they do not mean the field was observed continuously at every point. The underlying model and its uncertainty determine what the animation can support.

Make a caption test before sharing an anomaly image: replace “the hole is growing” with the actual plotted quantity, date interval, and threshold. If those details are missing, the picture may still be informative, but its apparent boundary should not be treated as a precisely measured wall. A contour is a selected value in a continuous field.

Does a weak region announce a reversal?

Not by itself. USGS guidance on reversals explains that the geological record contains changing polarity and excursions without a regular reversal timetable. A regional anomaly is not sufficient evidence for a dated prediction of a global transition.

It is equally unhelpful to describe the field as either perfectly protective or completely absent. The magnetosphere and atmosphere have different roles, and the SAA’s practical concern is especially clear for spacecraft. A sensational ground-level catastrophe does not follow from an operational satellite hazard.

The useful anomaly

Read an actual mission description and look for its measurement altitude, detector type, and data-screening rules. Then return to the field map. The connection between them becomes more concrete than a frightening red circle.

The SAA is compelling because one regional pattern connects a telescope’s noisy detector, the motion of charged particles, and liquid-metal processes thousands of kilometers below our feet. It becomes more interesting as those links become more precise.

Sources and a next step

Continue exploring art, ideas, and unexpected connections at Incoprea.
The Elevator With Three Working Buttons

Case 50 · shortest-path challenge · Hard · About 10-15 minutes The archive elevator has a peculiar test mode. Its floor display works, but o...