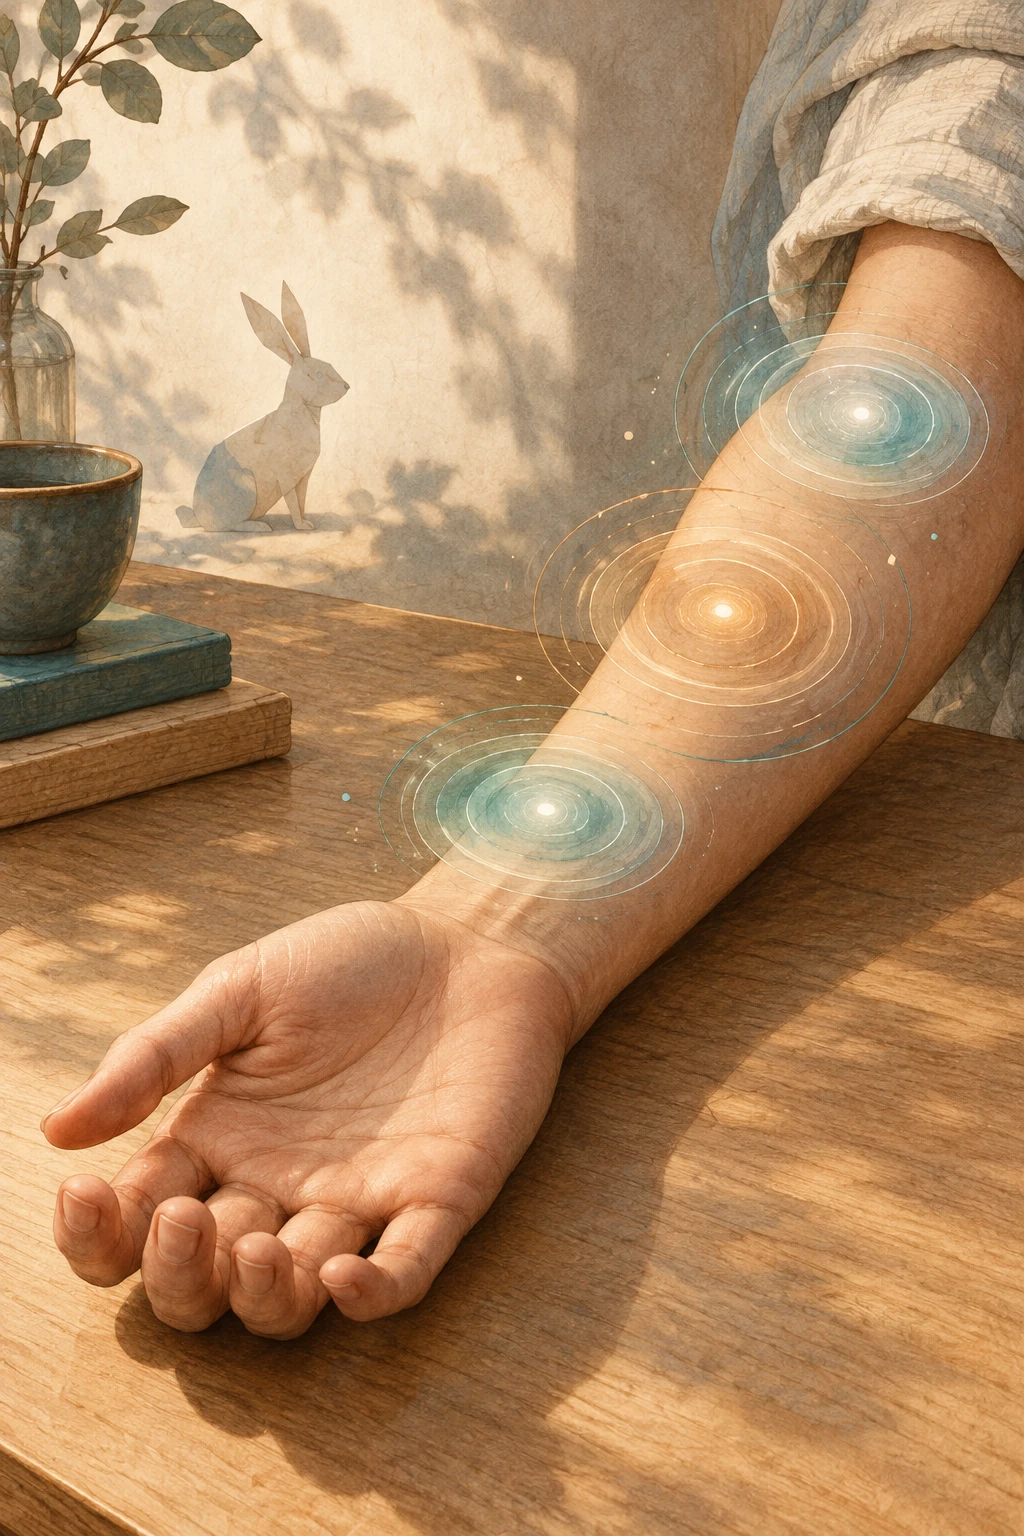
The taps land near the wrist, then farther up the arm. Under the right timing, a person can feel touches at intervening places that were never physically tapped. The cutaneous rabbit gets its name from that apparent hopping path. No animal, nerve impulse or pressure wave has traveled along the skin in the way the percept suggests.
This is an unusually clear separation between where stimulation occurred and where touch seemed to occur. It turns a familiar sense into a measurement problem: the experimenter controls physical contacts, while the participant reports an experienced location. The two maps can differ systematically.
A sequence has a shape as well as a count
Imagine two locations labeled A and B along a forearm. A rapid sequence includes several contacts at A followed by contacts at B. An observer's report can spread perceived events through the space between them. The precise effect depends on timing, pattern and arrangement; tapping randomly by hand is not a guaranteed reproduction.
For a thought experiment, draw A and B on a line. Underneath, write an actual-contact sequence such as A, A, A, B, B. On another line, draw a possible reported path with intermediate locations. Keep the two records visibly separate. One is the experimenter's stimulus log; the other is a perceptual report. A good account needs both, including the response uncertainty.
Now make a prediction before consulting an explanation: would a longer pause between the groups make a continuous hopping path more or less compelling? That question changes one temporal relationship while preserving the two physical sites. It illustrates how an illusion becomes an experiment rather than only a surprising story.
The map appears in brain activity too
Felix Blankenburg and colleagues' 2006 study used functional MRI to investigate a rabbit sequence on the forearm. Compared with control stimulation at the same skin sites in a different order, the illusion condition produced activity in a primary somatosensory location corresponding to the perceived intermediate area. The authors also compared it with actual stimulation of that intermediate position.
That is stronger evidence than a participant merely agreeing with a suggestive question, but it is still a specific result. It does not mean an MRI image directly displays a private experience in complete detail, or that one cortical patch alone explains the percept. The controlled comparison connects a reported spatial illusion with a mapped neural response.
The experiment's order control is especially instructive. If the contacts occur at the same physical sites, but changing their order changes the resulting perception and activity, an explanation cannot depend only on which receptors received a contact. The organization of events over time matters too.
A model can prefer plausible motion
Daniel Goldreich and Jonathan Tong's modeling work explores tactile space-time illusions through Bayesian estimation with a preference for lower speeds. When measurements are uncertain, a model combines incoming evidence with expectations. Closely spaced events separated by a large physical distance can be estimated as a shorter traveled distance.
The phrase “the brain expects slow motion” is only a rough description of a proposed computational account. It is not evidence that a listener consciously chooses to imagine a rabbit. The model is valuable because it produces quantitative predictions that can be compared with reported locations and timing effects.
For an original analogy, suppose a blurry tracking system observes an object at two widely separated positions only a very short time apart. It might infer a very fast journey. Alternatively, if its position measurements are uncertain and its usual objects move slowly, its best estimate may pull the positions closer together. The analogy clarifies inference under uncertainty; it does not claim that touch uses a literal camera or software routine.
Change the uncertainty before changing the story
The low-speed account becomes clearer when it has controls you can inspect. Goldreich’s 2007 basic observer combines uncertain position measurements with a prior favoring slower motion. Its two-contact version contracts the estimated separation most at short intervals. This is a quantitative model of an inference, rather than a claim that two physical contacts alone reproduce every feature of a multi-tap rabbit sequence.
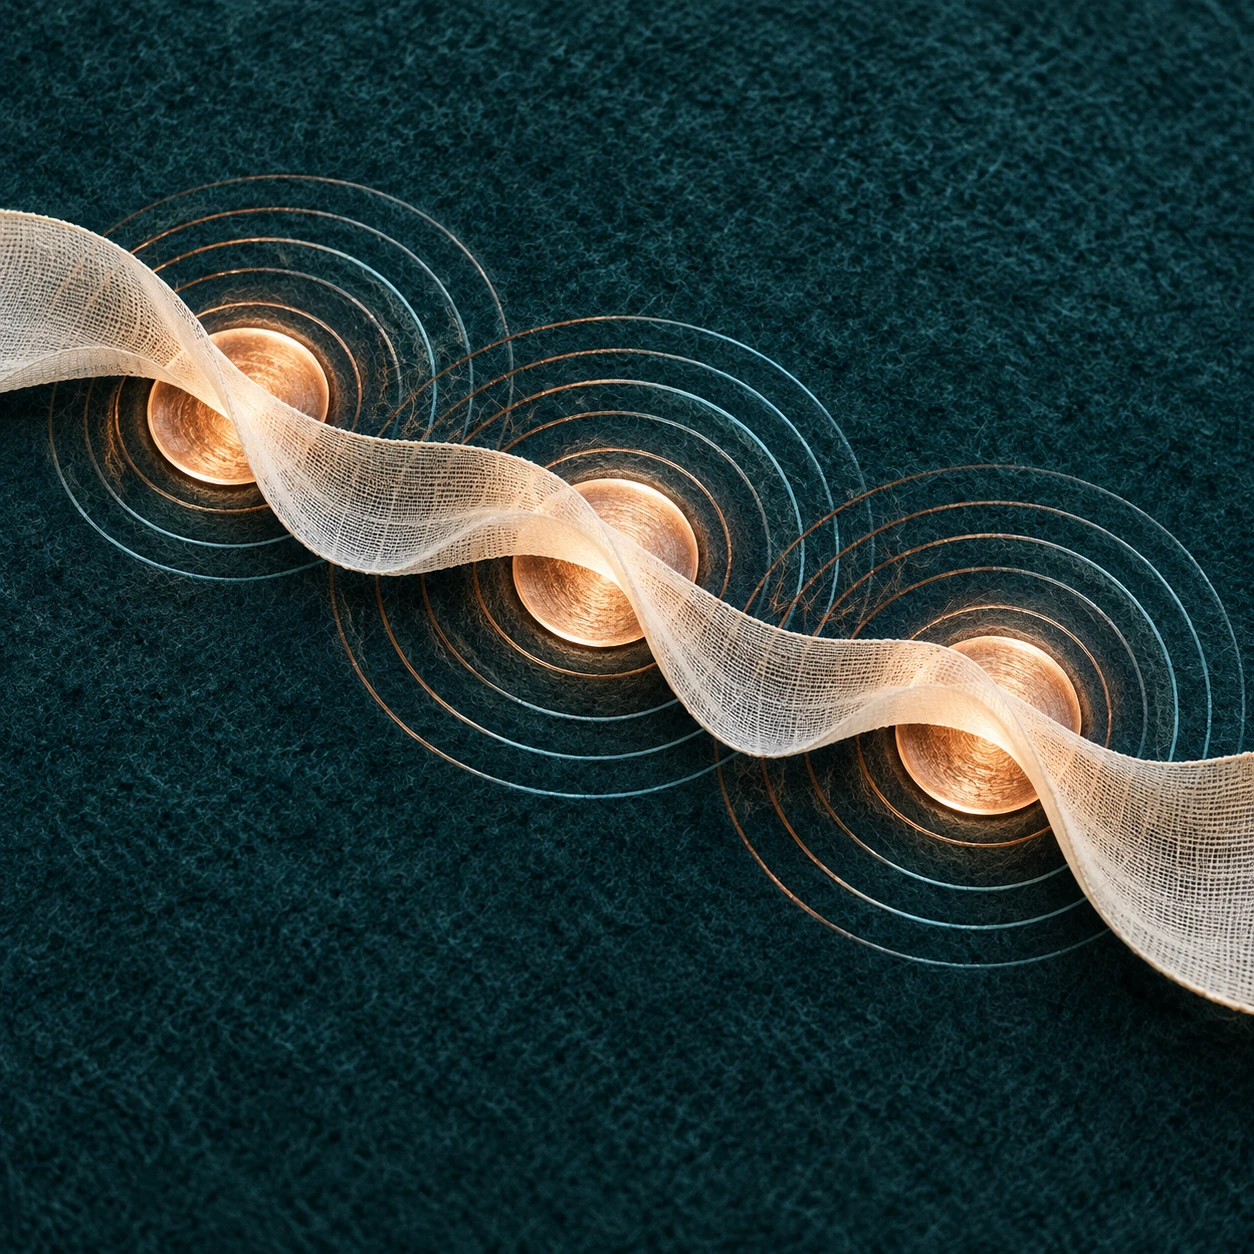
The silent calculator below exposes three assumptions: the physical separation, the time between contacts, and equal position uncertainty at the two sites. Its speed-prior width remains fixed at an illustrative ten centimetres per second. No stimulus is delivered to your skin, and its values are not estimates of your sensory precision.
Two contacts, one explicit assumption
Silent numerical model exposes the effects of time and position uncertainty with an equal-uncertainty Gaussian observer.
With a ten-centimetre separation, a tenth-second interval, and one-centimetre uncertainty at each site, the calculated separation is about 3.33 centimetres. Increase the interval to one second while retaining the other settings: it approaches 9.80 centimetres. The longer interval allows the same separation to imply less speed, so the slow-motion assumption exerts less pressure on the estimate.
Now keep time fixed and lower the uncertainty toward zero. The calculated separation approaches the physical separation. Precise evidence leaves less room for this prior to pull the two inferred locations together. These are consequences of the displayed equation, not new observations from participants.
Goldreich and Tong’s later treatment also considers unequal uncertainty at the two locations. The more precise location migrates less in the model, and the estimated midpoint can shift toward it. Our equal-uncertainty calculator deliberately keeps the midpoint unchanged; it does not quietly simulate that extension.
For a prediction exercise, sketch two contacts around a midpoint. Draw the estimated contacts closer together without moving that midpoint. Then mark one site as more precisely known and ask which part of your drawing would need a different rule. The question identifies an assumption you would have to alter before expecting a different outcome.
A model earns attention through such visible commitments. It becomes possible to say which result follows from timing, which follows from uncertainty, and which remains outside its scope. The rabbit’s surprise is still there, accompanied by a more demanding question: what would make this explanation fail?
The body is not always the whole reported path
Miyazaki, Hirashima and Nozaki's study extended the question to an arrangement involving a stick held between fingers. Under their conditions, participants reported an illusory tapping progression along a region outside the skin. That result complicates an explanation restricted to interpolation between adjacent points on a skin map.
It does not establish that every held object is automatically incorporated into perception in the same way. The experimental arrangement is the evidence. Its broader invitation is to ask how touch, posture and an object's relationship to the body contribute to experienced location.
| Record | What belongs there |
|---|---|
| Physical stimulation | Contact location, order, time and intensity |
| Participant report | Perceived number, location, movement and uncertainty |
| Model prediction | Estimated locations under specified assumptions |
| Neural measurement | A signal compared across defined experimental conditions |
Why a controlled sequence is better than a party trick
Manual tapping can vary in pressure, timing and contact area. An unsuccessful home attempt therefore cannot decide whether a published effect exists; a successful one cannot tell you which mechanism produced it. The most useful reader activity here is to compare the stimulus and reported-location diagrams in the source papers, then ask which variables their controls preserve.
That habit transfers well. Whenever an article says a sensation occurs “where nothing happened,” look for the physical log, the response method and the comparison condition. The most surprising experience becomes more meaningful when its boundaries are visible.
The rabbit leaves no footprints on the skin. Its trace is the difference between a delivered sequence and an organized percept. That difference reveals touch as a process that locates events in time, space and a body-related world, rather than merely labeling each contact point in isolation.
Sources and a closer look: Blankenburg and colleagues: somatosensory cortex experiment; Goldreich and Tong: Bayesian space-time model; Miyazaki and colleagues: rabbit outside the body.
Explore art, experiments and other unexpected connections at Incoprea.