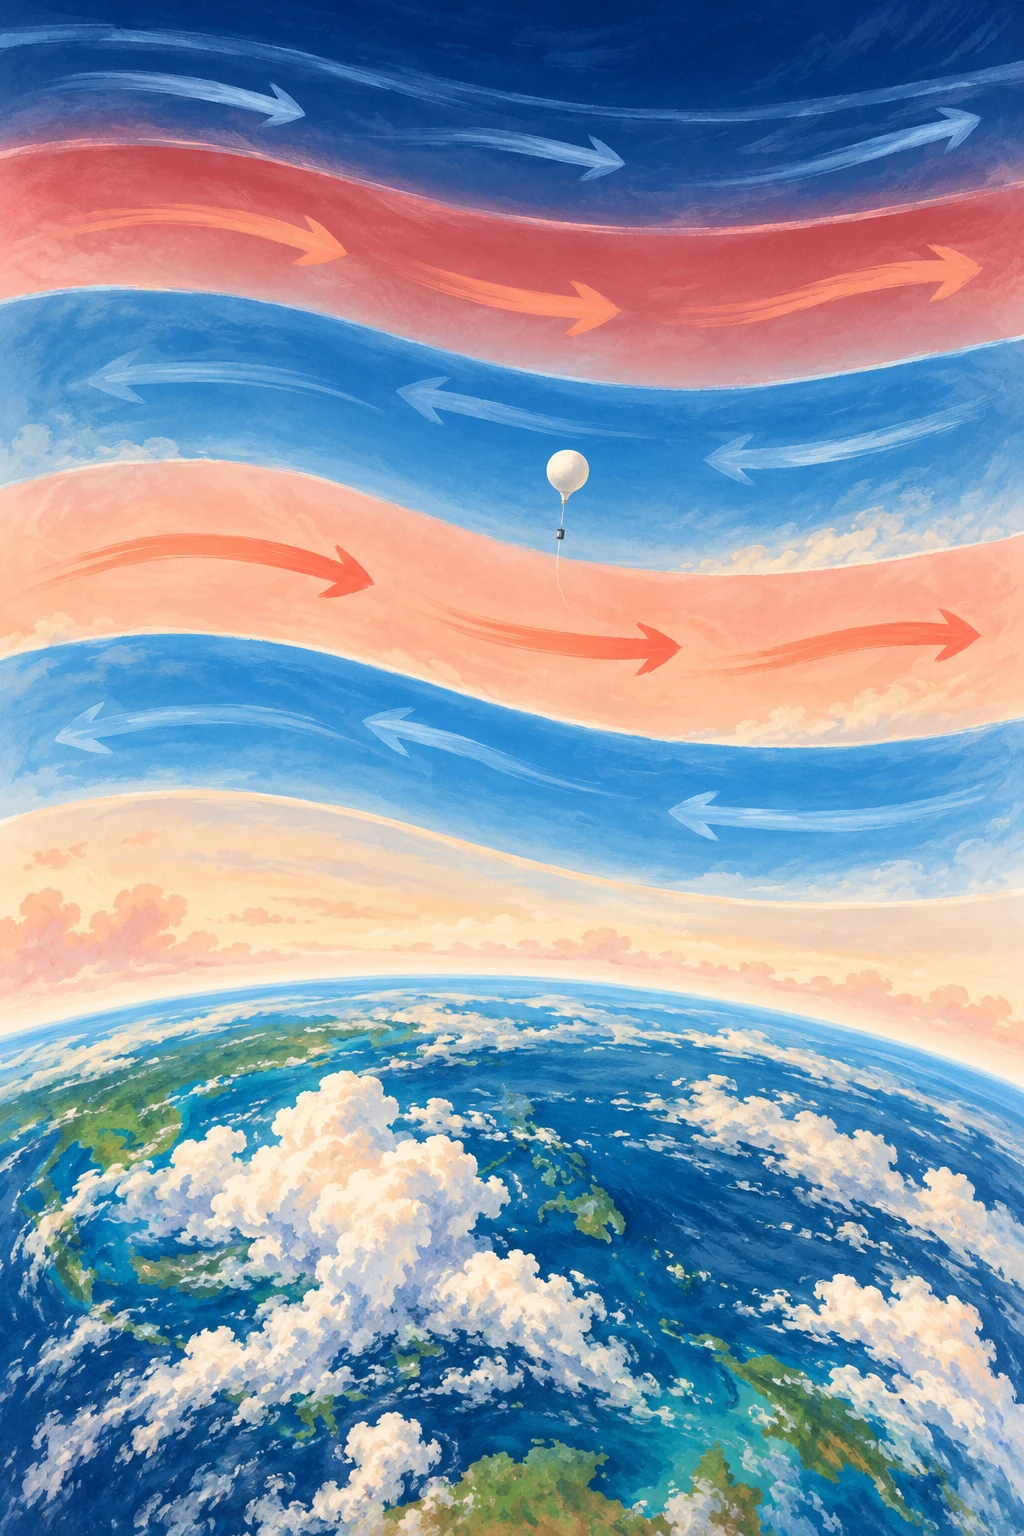
High above the tropical clouds, the wind can blow eastward at one height and westward at another. Over time, those broad wind regimes descend. A location that once had one direction acquires the other, then eventually returns.
The pattern is the quasi-biennial oscillation, usually shortened to QBO. Its name promises something close to two years, but its average full cycle is nearer 28 months. It is regular enough to help seasonal prediction and irregular enough to remind researchers that an atmospheric clock is not a mechanical clock.
A direction change that moves downward
The QBO concerns zonal winds—winds around the equatorial belt—in the stratosphere. NASA’s QBO data guide describes a downward-propagating wind variation, drawing on radiosondes, satellite observations, and assimilated datasets.
Downward propagation does not mean that an entire layer of air simply falls from the upper stratosphere to the lower stratosphere. It means that the phase boundaries and wind regimes appear at progressively lower heights. That distinction between a moving pattern and moving material recurs throughout wave science.
Imagine colored bands on a display that change one row at a time. A blue-to-red transition can travel downward even if no pixel moves. The analogy omits the fluid dynamics, but it prevents a misleading picture of a giant descending air conveyor.
The engine is in the waves
Waves generated in and below the tropical atmosphere carry momentum upward. As they interact with the background wind, different parts of the wave field deposit momentum at different levels. The evolving wind then changes which waves can continue upward. This feedback helps create alternating regimes.
Research evaluating QBO wave forcing in ERA 5 examines the contributions of different wave types. It is a richer problem than simply saying that equatorial heating reverses the wind on a schedule. The wave spectrum, background circulation, damping, and model representation all matter.
A numerical model also cannot explicitly resolve every relevant wave. Parameterizations represent some smaller-scale effects, and choices about them can influence whether the simulated QBO has the appropriate period, amplitude, and downward reach.
Read the striped chart as a story
A common QBO figure has time across the horizontal axis, pressure or height vertically, and color showing zonal wind. Trace a sloping edge downward and to the right: it shows a regime appearing at lower levels as time advances. At one date, different heights can have different phases.
Before naming the phase, specify the level. “The QBO is easterly” is incomplete if the speaker does not identify the pressure level or index used. A layer above may already have changed direction while the level used in a seasonal forecast has not.
- Read whether the vertical axis is height or pressure; pressure usually decreases upward.
- Check the sign convention for eastward and westward winds.
- Follow one level across time, then follow one regime downward.
- Keep measured station winds separate from a model reanalysis or forecast.
This is a reading exercise, not an invitation to infer tomorrow’s local weather from one stripe. The QBO is a large-scale influence with statistical connections, not a daily forecast for a particular street.
What happened when the clock stumbled
NASA’s 2016 account described an unprecedented disruption in the then-observed record: an unexpected wind structure interrupted the usual descent. The report posed questions about possible causes rather than declaring one proven explanation.
That date matters. A news article written while an event was under investigation is evidence of what was known then, not a final statement that no later analysis exists. It is also not evidence that the oscillation permanently stopped.
Research on the disrupted pattern’s recovery found that recovery involved a substantial phase delay. The lesson is more interesting than “the clock broke”: atmospheric regularity emerges from interacting processes and can be reorganized when unusual forcing enters the system.
Another way to inspect the chart is to compare a calendar expectation with a phase expectation. Mark a date exactly two years after one wind reversal, then find where the next comparable reversal actually occurred. The mismatch is not automatically an error in the data: the name describes an approximate rhythm. Next mark the same phase at another pressure level. You now have two kinds of difference, variable cycle length and vertical phase lag. Keeping them separate makes it easier to understand why a forecast index must state both its level and its date. A familiar label can otherwise conceal a changed definition from one discussion to the next.
How a tropical wind can matter far away
The QBO affects the stratospheric circulation and can influence conditions at higher latitudes. The Met Office’s climate-driver guide discusses its relationship with the polar vortex and winter weather probabilities, while stressing interactions with other drivers.
A changed probability is not a guarantee. ENSO, the state of the ocean and land, internal weather variability, and other stratospheric conditions can combine differently in different years. A phase can be associated with an increased chance of a type of winter without producing that winter every time.
This is an excellent place to practice probabilistic language. “Favors,” “raises the chance,” and “contributes information” are more faithful than “causes this winter” when the evidence concerns a distribution of possible outcomes.
Make a two-level timeline
Use a public QBO chart and choose two clearly marked pressure levels. Mark the dates each changes sign. Measure the lag between them, then compare a later cycle. You should expect a pattern rather than a perfectly fixed interval. Note any data gaps and avoid reading the color boundary more precisely than the plotting resolution allows.
The activity converts an abstract oscillation into something you can follow. It also shows why a single index compresses a three-dimensional evolving atmosphere. The tropical stratosphere carries an unusually recognizable rhythm, but the rhythm is made by the atmosphere each time it plays.
Sources and a next step
- NASA: QBO observations and time-height charts
- Pahlavan et al.: QBO wave forcing in ERA 5
- NASA: the 2016 disruption
- NASA NTRS: recovery of the disrupted QBO
- Met Office: seasonal climate drivers
Continue exploring art, ideas, and unexpected connections at Incoprea.