A star does not need to explode twice for astronomers to watch its explosion more than once. Between the star and the telescope, a massive foreground structure can direct light along several routes. Different travel times turn one distant event into several arrivals.
Supernova Refsdal supplied a remarkable test of this idea. Four images appeared in observations in late 2014. Researchers then predicted another appearance elsewhere in the field. Hubble observed that later arrival in December 2015.
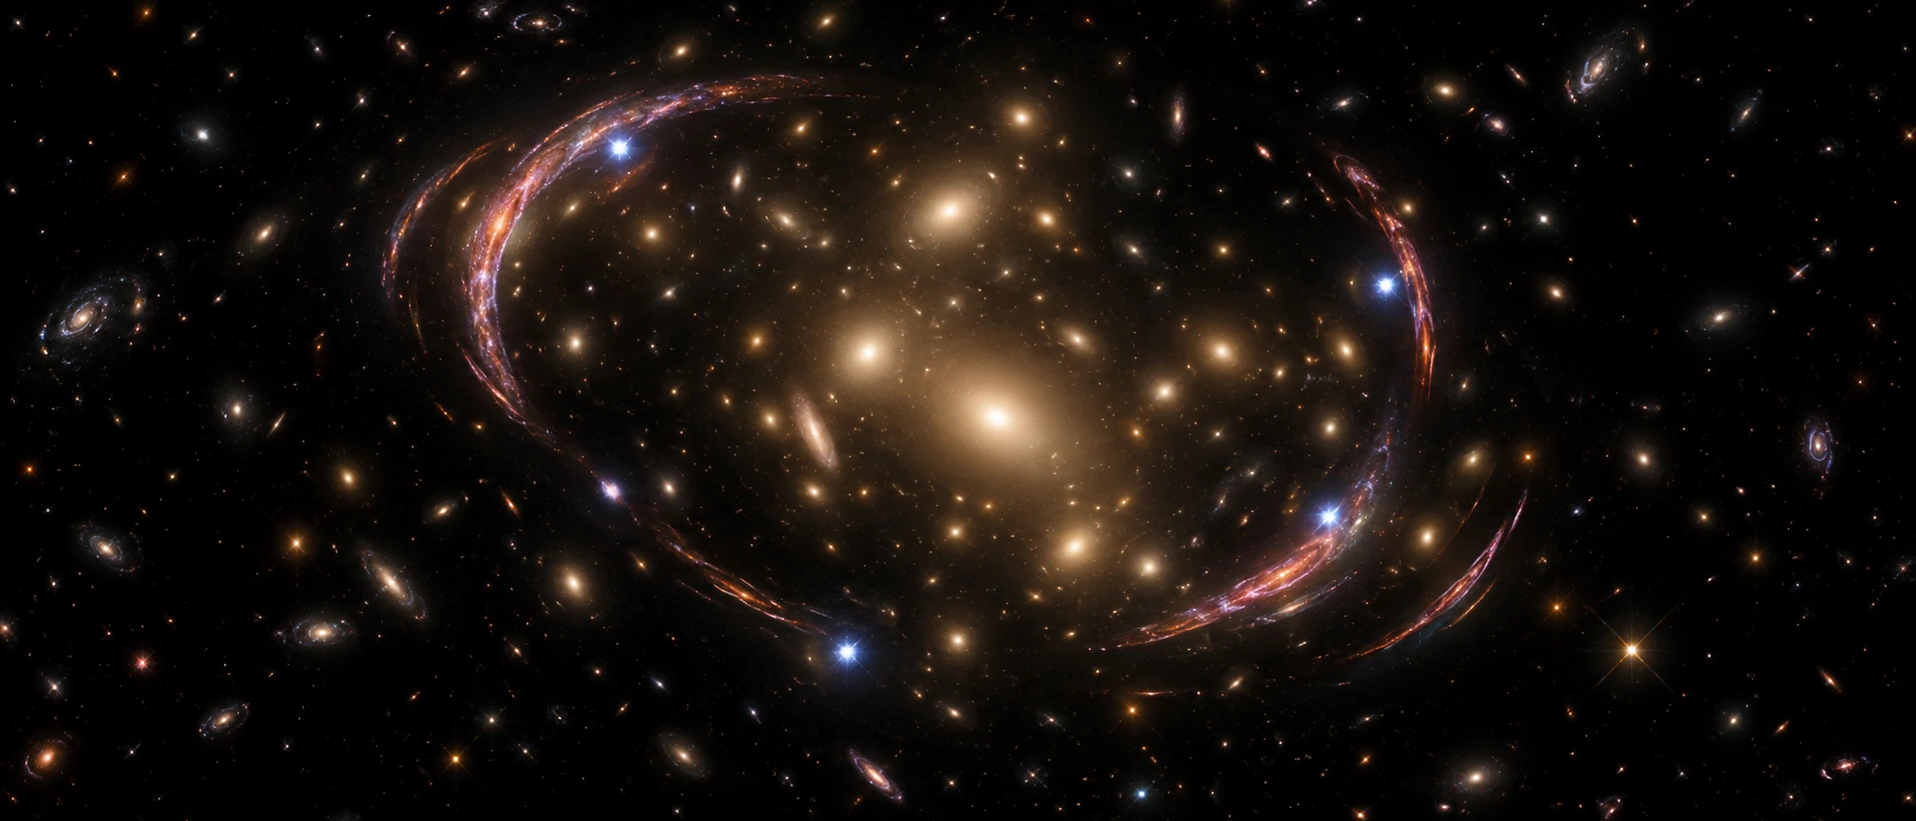
The Hubble team’s account makes a crucial distinction: another, earlier appearance was calculated to have occurred around 1998, but no telescope observed it. A label on a reconstruction is not a historical detection.
What the extra images represent
The foreground galaxy cluster and a galaxy within it bend light from the background source. The resulting images occupy different apparent positions. They are not separate copies of the physical star sitting side by side in space.
Travel time in gravitational lensing contains both a geometric contribution and a contribution associated with the gravitational potential along the route. A highway analogy captures different arrival times but misses that second part. Measuring the angular separation alone is therefore insufficient to calculate the delay.
The lens also changes apparent brightness. Two images of the same explosion can differ in both arrival time and magnification. To compare them, astronomers follow their light curves: records of brightness against observing time.
A useful mental exercise is to imagine a source with two distinctive changes rather than one isolated peak. If both changes recur in the second image with the same separation, they help identify the shared source history. A brightness difference can be corrected separately from a horizontal time shift.
This does not make a real supernova a perfectly repeated graph. Noise, background light, incomplete observations and smaller-scale lensing can complicate the match. The purpose of the extra structure is to constrain an inference, not remove the need for uncertainty.
Start with an idealized delay you can recover
The model below contains two invented, noiseless curves. The second is 1.6 times brighter and delayed relative to the first. The display corrects the brightness factor for you. Your task is to choose the time shift that makes their two features coincide.
Align two delayed light curves
A keyboard-controlled alignment model with invented data, known magnification and an explicit unique37day answer.
Begin at zero delay. Move the slider until the broad rise overlaps, then inspect the smaller feature. A setting that fits one part poorly can be rejected even if another part looks plausible. The numerical mismatch uses all the sampled points rather than asking your eye to choose a favorite peak.
Check the answer and the sign of the shift
The constructed delay is 37 days. If the source is F(t), the second curve is B(t)=1.6F(t−37). The comparison therefore evaluates B(t+37)/1.6 against F(t). Adding 37 to the second curve’s observing time compensates for its later arrival.
Among the model’s integer settings from zero to seventy days, 37 is the unique exact match. The example has a known magnification, uninterrupted sampling and no noise. It estimates no distance or cosmological parameter.
Notice what you have recovered: an arrival-time difference measured at the observer. You have not learned the full three-dimensional shape of either light path, the mass of the cluster or the expansion rate of the universe. Those require additional information and a physical model.
Real curves do not offer a single perfect template
Rodney and colleagues’ early Refsdal analysis followed the first four images through a slow rise and broad maximum. It compared supernova templates with more flexible polynomial representations because no template fully captured the event’s behavior.
Those approaches yielded consistent delay estimates, with uncertainties. The point is stronger than a perfect-looking overlay: researchers investigated whether an imperfect description of the source’s changing brightness could bias the timing result.
Try the same critical question on the small model. If the second curve had an unexplained extra bump, which parts would you trust for alignment? If the broad maximum fell in a gap between observations, how tightly could you locate it? If brightness normalization were unknown, could changing it disguise a wrong shift?
The model does not solve these harder cases. It gives you a baseline against which to recognize them. A clean demonstration becomes useful when its missing complications are stated clearly enough that readers can identify where real research begins.
The later arrival became a sharper test
A 2023 analysis by Kelly and colleagues measured the delay between the later image and the first of the earlier images as 376.0 days, with uncertainties of roughly five to six days. The study used four techniques and incorporated effects from smaller-scale lensing.
The number belongs to that particular pair of images. It is unrelated to the invented 37-day exercise. The paper also estimated relative magnification, which had a larger fractional uncertainty than the delay. A well-measured time difference does not imply equally precise knowledge of every lensing property.
The observed position, brightness and timing of the reappearance tested predictions made before it arrived. That ordering matters. Adjusting a model after seeing an event can improve a fit; predicting an unseen appearance supplies a different and demanding check.
From a delay to a cosmological result
Grillo and colleagues’ 2024 cosmographic study combined Refsdal’s measured delays with the positions of many lensed images and a cluster mass model. Extensive imaging and spectroscopic information supplied constraints that the timing alone could not provide.
The inference connects the gravitational potential, source and lens redshifts, and distance relations in a cosmological model. For fixed relevant lens-model quantities, a larger inferred expansion rate corresponds to shorter predicted delays. This is why time delays can contribute to measuring the Hubble constant.
It is also why “a supernova measured the universe’s expansion” compresses too much. The result comes from the event plus the lens model plus other observations. Its uncertainty must reflect that chain. The impressive part is not that the intervening cluster disappears from the problem; it becomes a constrained part of the measurement.
Refsdal turns a distorted astronomical image into a time experiment. The repeated arrivals preserve information about both a distant explosion and the matter between it and us. Once you have tried aligning even two invented curves, the real achievement becomes easier to appreciate: recovering a shared history through a complicated gravitational foreground.
Sources and further exploration
- NASA and ESA: Hubble captures the predicted reappearance
- Rodney and colleagues: Refsdal photometry and early time delays
- Kelly and colleagues: Five images and measured time delays
- Grillo and colleagues: Cosmography through time-delay cluster lensing
Explore all 80 new articles · Browse the complete illustrated collection
Keep exploring at Incoprea.