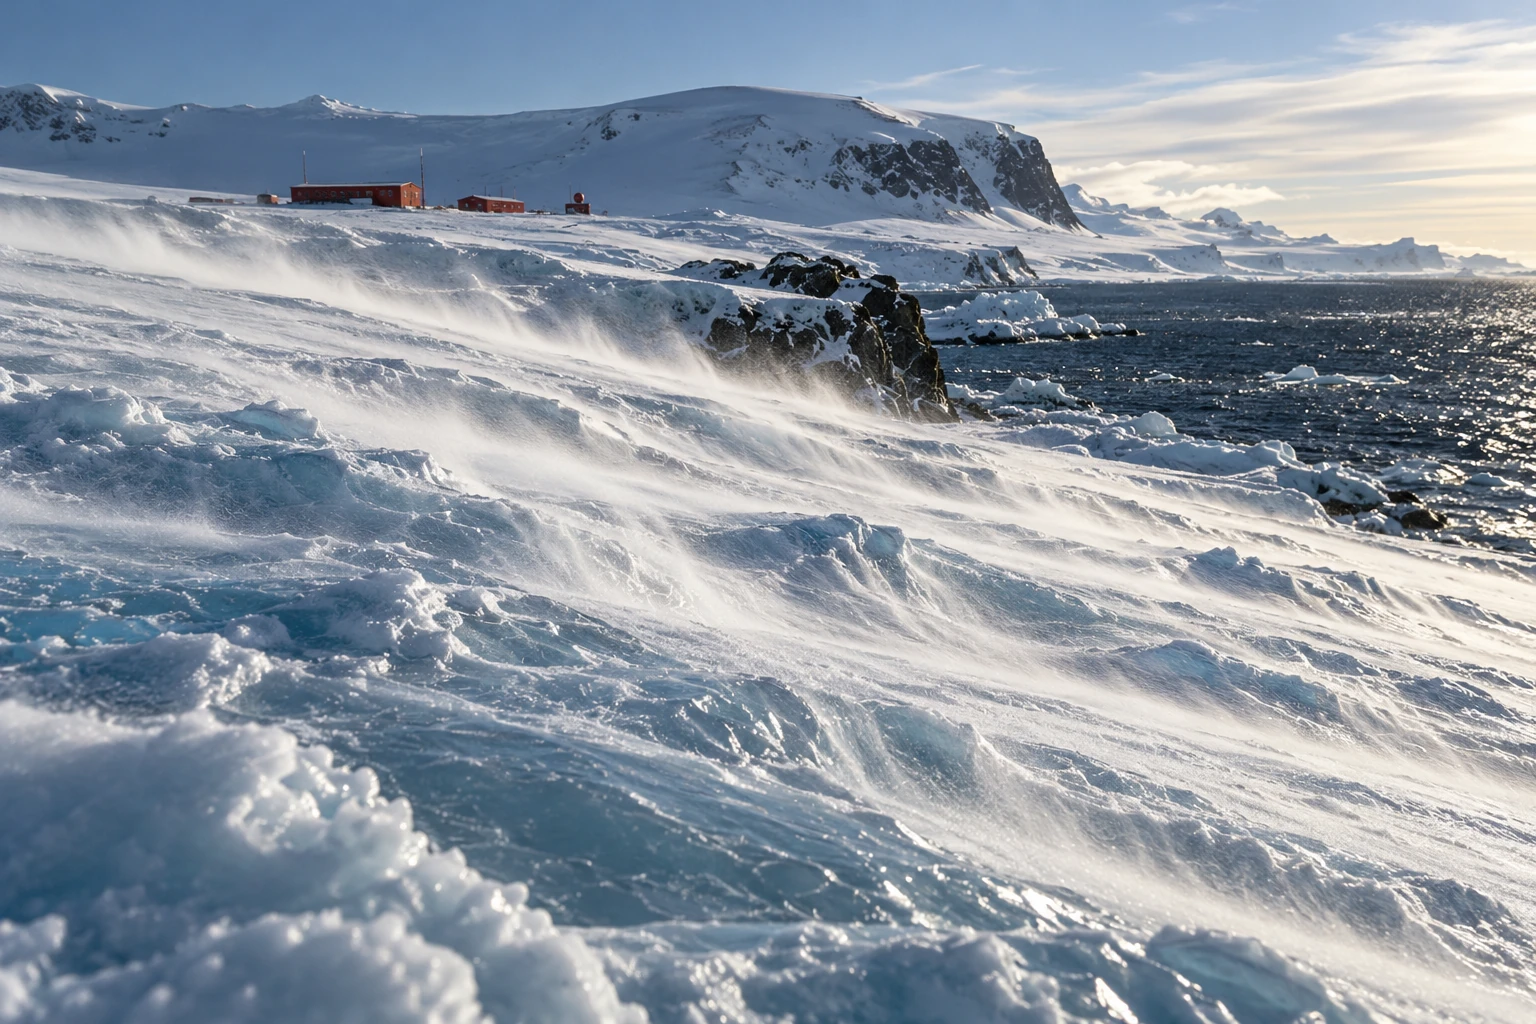
On an Antarctic slope, the ground can make the wind. Air near the radiatively cooled ice becomes colder and denser than air at the same level away from the slope. Gravity gives that dense layer a downhill component of motion.
This is the katabatic mechanism. Its simplicity is appealing, but the continent’s actual wind is a negotiation among buoyancy, surface drag, terrain, Earth’s rotation, and the surrounding weather. A downhill arrow is the first sketch, not the finished explanation.
A cold layer with somewhere to go
Antarctica’s ice surface rises from coastal margins toward a high interior. Cooling near that surface can generate a shallow density contrast. The downslope component of buoyancy drives flow, and terrain can collect it into preferred routes.
The Australian Antarctic Program’s explanation emphasizes how the ice-sheet shape guides persistent coastal wind directions. It also distinguishes near-surface downslope winds from the stratospheric polar vortex. One is not simply the low end of the other.
Descending air can warm through compression while still being cold relative to its surroundings. “Cold air flows down” should therefore not be interpreted as an air parcel keeping exactly the same temperature throughout its journey. The driving comparison is with the environment at the same level.
Why every coastal gale is not purely katabatic
The program’s broader weather guide explains that nearby low-pressure systems can strengthen the coastal flow. The direction can look katabatic while the large-scale pressure field provides a substantial part of the forcing.
A Coats Land study by Renfrew and Anderson deliberately examined an ordinary katabatic regime rather than only exceptional extremes. Its selection criteria separated primarily buoyancy-driven cases from winds that merely resembled them in speed and direction. That is an important methodological distinction.
If you identify a mechanism only from the outcome it often produces, you risk circular reasoning. A southerly wind on a coastal slope may be consistent with katabatic forcing, but consistency is not a full diagnosis of the force balance.
The strongest wind can be above your boots
Surface friction slows the air closest to the ice. A katabatic wind profile can therefore contain a maximum above the surface, then weaken farther aloft as the buoyancy influence decreases. Its height and depth vary with the regime.
A profiling study in Coats Land used Doppler sodar and supporting observations to investigate these vertical structures. It found distinct shapes and depths under different conditions, demonstrating why a single wind measurement cannot describe the whole layer.
The study’s specific maxima are local results, not a universal specification for Antarctica. A steep, confined coastal outlet can behave differently from a broad, modest slope. A memorable extreme-wind record says little about the ordinary profile at another station.
Try the slope-and-density sketch
Draw a slope and a thin band of cooled air resting on it. Add a downward gravity arrow. Split its effect conceptually into a component into the surface and a component along the slope. The along-slope component helps you understand why even a gentle incline can support organized flow when the cooled layer extends over a large area.
Now add three complications: surface drag, a sideways rotational deflection, and an external pressure-gradient arrow. The sketch no longer predicts a straight slide down the steepest line. That is a feature of the exercise: it shows what the one-arrow cartoon leaves out.
This is not a numerical model. A real calculation needs the density deficit, layer structure, mixing, pressure field, and boundary conditions. The paper version simply keeps the important forces from disappearing behind the familiar name.
Snow is a tracer and a measurement problem
Low streamers of loose snow can reveal surface flow, while deeper blowing snow can reduce visibility dramatically. Snow movement also complicates snowfall measurements: material passing a gauge need not all be newly falling precipitation.
When looking at a photograph, distinguish a visible snow plume from the full depth of the air current. The snow’s availability, grain properties, and lifting conditions affect what you see. Clear air above a plume is still moving, even if it carries no visible tracer.
A weather report should likewise separate sustained wind, gusts, measurement height, and averaging interval. Comparing a brief gust from one station with a long-term mean from another creates a dramatic but scientifically unhelpful contrast.
In the slope sketch, make the same height drop gradual in one panel and confined to a shorter steep section in the other. Then add a narrow outlet to only one panel. The exercise does not calculate wind speed, but it reveals three geographical questions that a regional average conceals: where the buoyancy acts, how the flow converges, and what happens after it leaves the slope.
What happens when the slope ends?
A simple cartoon sends cold air to the coast and stops. Actual flows can adjust over an ice shelf or sea, interact with regional winds, or remain organized when terrain channels them strongly. Research on near-surface ice-shelf winds compares differing behavior at the Brunt and Ross ice shelves and discusses the role of confinement and adjustment.
The lesson is geographic. The same driving principle encounters different downstream environments. The coast is not a universal off switch, and a particularly strong outlet should not stand for the whole Antarctic margin.
A better way to read the landscape
On a topographic image, trace broad ice slopes, converging valleys, and the transition to flat shelf or sea. Then compare those features with a wind rose whose station, time span, and height are known. Ask whether the favored direction follows the local fall line or is offset, and whether strong events occur under particular large-scale weather patterns.
You do not need an expedition to appreciate the result. A continental ice sheet is not merely a passive white surface beneath the atmosphere. Through cooling and terrain, it helps organize the air immediately above it—and the resulting wind gives the shape of the ice a powerful, moving expression.
Sources and a next step
- Australian Antarctic Program: downslope winds and polar vortex
- Australian Antarctic Program: Antarctic weather
- Renfrew and Anderson: ordinary Coats Land katabatic climatology
- Renfrew and Anderson: vertical wind profiles
- King: winds over an Antarctic ice shelf
Continue exploring art, ideas, and unexpected connections at Incoprea.