A sea chart can make land look like the margin of the story. Names crowd the coast. Fine lines cross open water. Inland places may receive much less attention. The pattern tells you something about the questions the chart was made to answer.
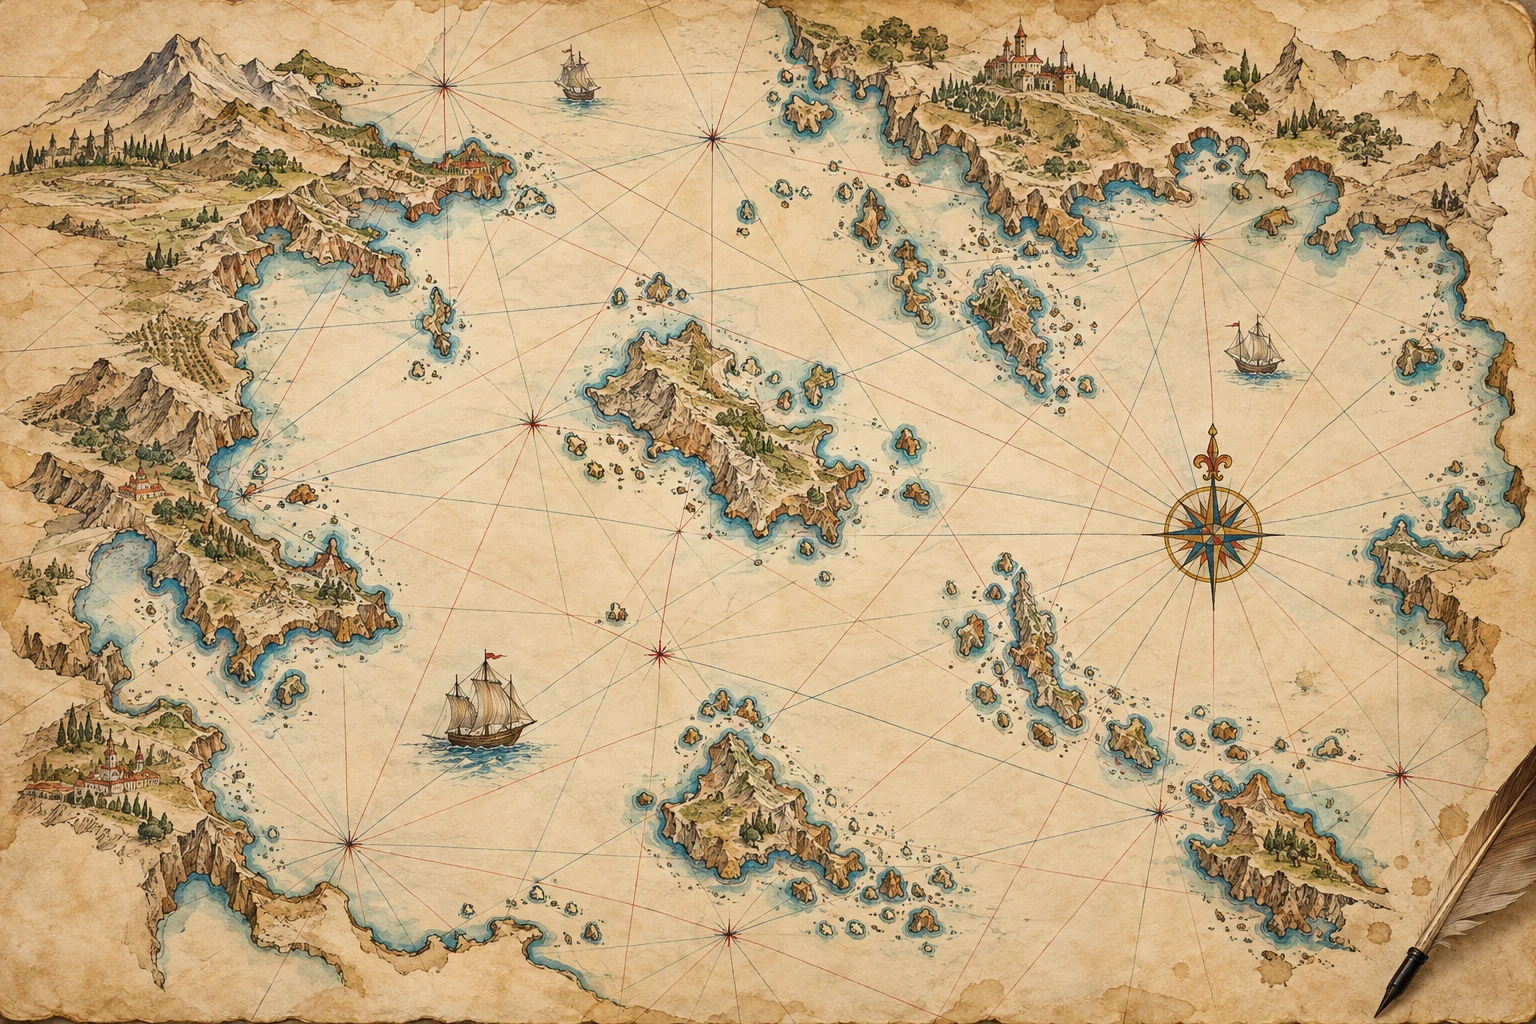
The Library of Congress guide to portolan charts describes a tradition emerging in the late thirteenth century with a strong interest in coastlines, ports, and bearing lines. It also reminds readers that charts could be made for display as well as practical use. An impressive chart is not automatically evidence of a voyage.
Read the lines as directions
The crossing networks are commonly described as rhumb-line or bearing networks. They offer directions across the chart, often organized around compass roses or related centers. They are not simply decoration, but neither should every crossing line be read as the track of a ship that once sailed there.
Compare this with a familiar modern road map. The map may contain a grid, road symbols, scale, and labels. Those elements help organize possible movement; they do not all represent journeys already taken. A bearing network similarly belongs to the chart's way of arranging information.
A bearing line is one piece of a route
A unitless fictional coast and adjustable ray separate direction from distance, safety, and historical chart conventions.
Open a bearing line is one piece of a route in its own window.
The interactive ray begins at a fictional harbor. Changing its angle changes direction, while leaving distance unanswered. Turn it toward the land and the limitation becomes obvious: a line can point through an obstacle. The model supplies no safe route, current correction, wind allowance, or historical magnetic adjustment.
This deliberate incompleteness is useful. A direction is one ingredient of navigation. A chart's coastline, place names, distance scale, and other marks must be read with it. An attractive network does not remove the need to identify what the surrounding information actually says.
North may be somewhere you did not expect
A chart attributed to Placido Oliva in the Library of Congress is cataloged with north to the right, indicated by fleurs-de-lys. Its record notes multiple compass roses and two scale bars whose units are unidentified. Those details are excellent reminders not to import a modern map's conventions without checking.
Start by finding an orientation indicator rather than assuming the top edge means north. Then locate the scale and read what the catalog actually establishes. If the unit is unidentified, do not quietly turn its marks into miles or kilometers. A calculation can be perfectly performed on an unjustified assumption and still produce a misleading result.
The same record gives an uncertain date in the 1580s and mentions a fragmentary signature. A catalog's question marks and brackets are part of its information. Removing them makes the object seem more firmly identified than the evidence allows.
A tradition changes across centuries
The Library's anonymous Mediterranean chart dated approximately 1320–1350 offers an early comparison on vellum. Its catalog describes probable Genoese production. “Probably” is doing real work: an attribution can be persuasive without being a named maker's signed statement.
For a much later comparison, the 1633 chart by Pascoal Roiz covers the Atlantic and adjacent continents while remaining cataloged within the portolan tradition. This is why a short description of early Mediterranean charts should not become an absolute rule about every later object carrying the same category name.
Try a chart-reading sequence
- Locate the north indicator before orienting the image.
- Choose one coastline and note where its names are placed.
- Separate a bearing line from a drawn coastline.
- Find a scale, and record whether its units are established.
- Read the catalog date, maker attribution, and material with all qualifications intact.
Now compare the spaces that receive little detail. That absence may reflect purpose rather than ignorance. A chart designed around coastal movement need not answer the questions a political atlas or land survey would prioritize. Different maps distribute attention differently.
Portolan charts become easier to appreciate when their dense linework stops looking like a puzzle to decode in one glance. Read one element at a time, then put the elements back together. The result is a more specific encounter with a working visual language and its changing uses.
Sources and further exploration
- Library of Congress: Portolan Charts research guide
- Library of Congress: Placido Oliva chart
- Library of Congress: Mediterranean chart 1320–1350
- Library of Congress: Pascoal Roiz Atlantic chart 1633
Explore all 80 new articles · Browse the complete illustrated collection
Continue exploring art, ideas, and unexpected connections at Incoprea.