A navigation signal has an intended destination: a receiver that wants to know where it is. But radio waves are generous. Some reach the ground or sea, scatter, and continue into space. To a carefully designed satellite, that unwanted echo can become a measurement of the surface it touched.
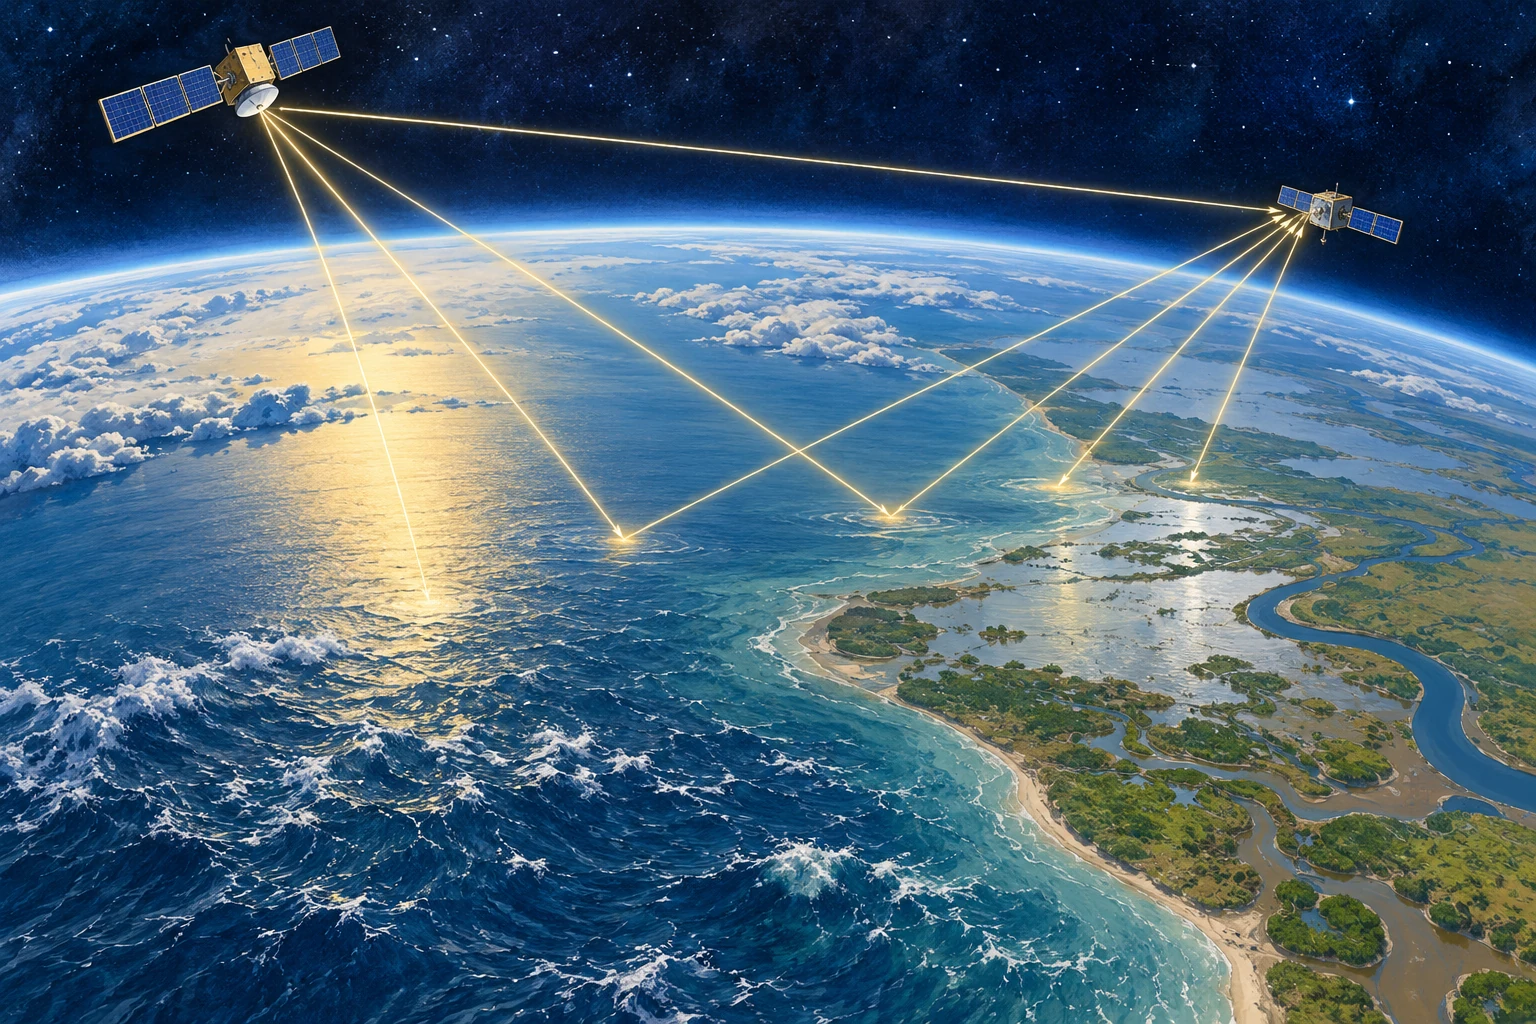
This is GNSS reflectometry: using reflected signals from global navigation satellite systems. Its appeal is not simply thrift. The reflections contain information that a direct signal does not, because their path includes an encounter with water, soil, vegetation, or ice.
Borrowing a transmitter changes the instrument
Ordinary radar sends out a pulse and listens for its return. A reflectometry mission can listen to transmissions already being broadcast by navigation satellites. The transmitting and receiving spacecraft are separate, and the reflection geometry changes as both move. This is a bistatic measurement rather than an echo returning to its own source.
NASA’s CYGNSS mission put this approach to work with a constellation of small spacecraft. The mission was designed to study ocean surface winds in tropical cyclones. The underlying chain is indirect: winds affect surface roughness; roughness alters how navigation signals scatter; the received pattern is interpreted with a physical model and calibration.
That chain is the article’s central caution and its main source of interest. The satellite is not feeling the wind. It is observing one consequence of the wind, amid other factors that also influence the signal. The quality of the inference depends on understanding that middle step.
A calm reflection and a rough one
Imagine a perfectly smooth mirror. For a particular arrangement of transmitter and receiver, a small region supplies a strong, organized reflection. Replace it with many tilted facets and the reflected energy spreads over a wider area and a different range of arrival delays. Ocean waves provide a constantly moving version of those facets.
The CYGNSS receiver organizes its observations into a delay-Doppler map: received power sorted by timing delay and frequency shift. NASA’s first-light explanation describes how reflected signal strength and roughness connect to the measurement. A delay-Doppler map is not a conventional photograph. Its axes describe the signal, not a simple north-up landscape.
As a reading exercise, replace the phrase “the satellite sees stronger winds” with “a retrieval estimates winds from a changed scattering pattern.” The second description sounds less immediate, but it tells you where calibration, modeling, and uncertainty enter.
Why clouds do not make this an optical camera
Navigation signals use microwave wavelengths. That makes them useful where visible-light views are obscured by cloud, and it helps the original cyclone application. It does not make the measurements immune to every atmospheric, surface, or instrument effect. Wavelength is a choice about which interactions matter, not a universal invisibility cloak.
The mission’s technical background material traces the wind-retrieval approach through modeling and earlier aircraft observations. That lineage is valuable: an elegant space concept becomes an operational measurement only after comparisons with other ways of measuring the same world.
The surprise on land
Water also changes how land reflects a microwave signal. Standing water can yield especially strong reflections, and soil wetness changes electrical properties. Researchers consequently investigated uses beyond the original ocean-wind task, including flood extent and soil moisture.
NASA’s 2018 account of flood detection describes this extension. The important word is extension: a mission designed for one geophysical target can reveal a different one when scientists examine its observations in a new context. It is not evidence that every reflection yields an equally accurate measurement of every surface property.
Vegetation, roughness, topography, and the reflection geometry complicate the land problem. A bright return does not, on its own, distinguish all combinations of wet soil, smooth inundation, and vegetation cover. Retrievals need additional information or assumptions, and their accuracy has to be evaluated for the setting in which they are used.
Build a retrieval chain on paper
Take a sheet and divide it into four boxes. Put “measured radio signal” in the first, “surface scattering” in the second, “estimated surface property” in the third, and “decision” in the last. Now try two versions:
- Ocean: signal pattern → roughness → estimated near-surface wind → cyclone research.
- Land: signal reflectivity → water-related surface response → estimated wetness or inundation → flood assessment.
Between every pair of boxes, add one assumption and one possible check. For example, the wind version needs a relationship between roughness and wind; an independent buoy observation can help test it. The land version needs to account for vegetation; field measurements can help reveal where that account fails.
This is a conceptual activity, not a recipe for processing satellite observations. Its value is that it prevents the final decision from hiding the inferential steps beneath it. Many useful environmental products are several steps removed from the raw detector reading.
One signal, more than one path to understanding
A NASA collaboration using aircraft-based receivers illustrates a further possibility: similar reflection measurements can be explored from platforms other than dedicated satellites. The transmitter infrastructure already exists; researchers can change where and how they listen.
That is the deeper idea worth carrying away. A signal can be useful twice: once for the purpose its engineers intended, and again because the world modifies it on the way. The scientific invention is the disciplined reading of that modification. The echo is not waste after all; it is a record of an encounter.
The same echo can improve when the calibration changes
A satellite dataset has a version number for a scientific reason. The recorded bits are only one stage in the route to a geophysical product. Antenna response, transmitter properties, instrument quantization, and the geometry of the reflecting area all influence how those bits become calibrated power or scattering strength.
Compare NASA’s records for CYGNSS Level 1 version 2.1 and version 3.1. The earlier release lists changes involving coordinate frames, antenna patterns, and the specular point. The later one documents revised antenna calibration and a correction to coarse quantization effects that had contributed to persistent location-dependent biases. These are descriptions of particular releases, not a recommendation to select either as the current product.

This gives a more subtle explanation for a changed map than “the ground became wetter.” The planet can change, but the processing can change too. A comparison that mixes releases without checking their definitions can place both effects in the same apparent environmental trend.
A small data detective exercise
Imagine an invented study of two fields. In the first analysis, field A has a reflectivity index of 12 and field B has 10. A recalibration changes them to 11 and 11. No new rain has fallen between these two analyses: they use the same observations. The initial contrast was sensitive to the measurement model. That does not establish that the two fields truly have identical moisture, either; the index remains an indirect observable.
Write a comparison note with five entries: observation dates, product level, release version, units, and quality screening. Then add the surface explanation you want to test. Which entries describe the Earth, and which describe the way the instrument and software represent it?
Repeat the exercise with a genuinely later observation processed using the same release. This time an environmental explanation becomes more plausible, but vegetation, roughness, and geometry still need attention. Good calibration does not eliminate the retrieval problem. It makes that problem better defined.
The photograph-like surface comparison above is deliberately not a radio measurement. It supplies two recognizable environments to think about. The numerical evidence would remain in the calibrated observations, their uncertainty, and the retrieval documentation. Keeping those roles separate lets an engaging illustration support the article without silently becoming its proof.
What a map’s blank space can mean
A constellation does not measure every location at the same instant. The navigation transmitter, receiving satellite, and surface must form a usable geometry, and individual observations then pass quality checks. A map assembled from them can therefore have gaps that reflect sampling or screening rather than a dry or calm surface.
Before using any environmental image, read the time interval, footprint size, quality flags, and legend for missing values. A daily composite can contain observations made hours apart; a colorful grid cell can summarize an area larger than a field. These are ordinary properties of remote measurements, but they matter when comparing a satellite product with an observation made at one place and one moment.
Sources and a next step
- NASA: CYGNSS mission
- NASA: first-light reflected signal measurements
- NASA: mission technical background and wind retrieval
- NASA: flood detection as an additional capability
- NASA: aircraft-based reflection measurements
Continue exploring art, ideas, and unexpected connections at Incoprea.