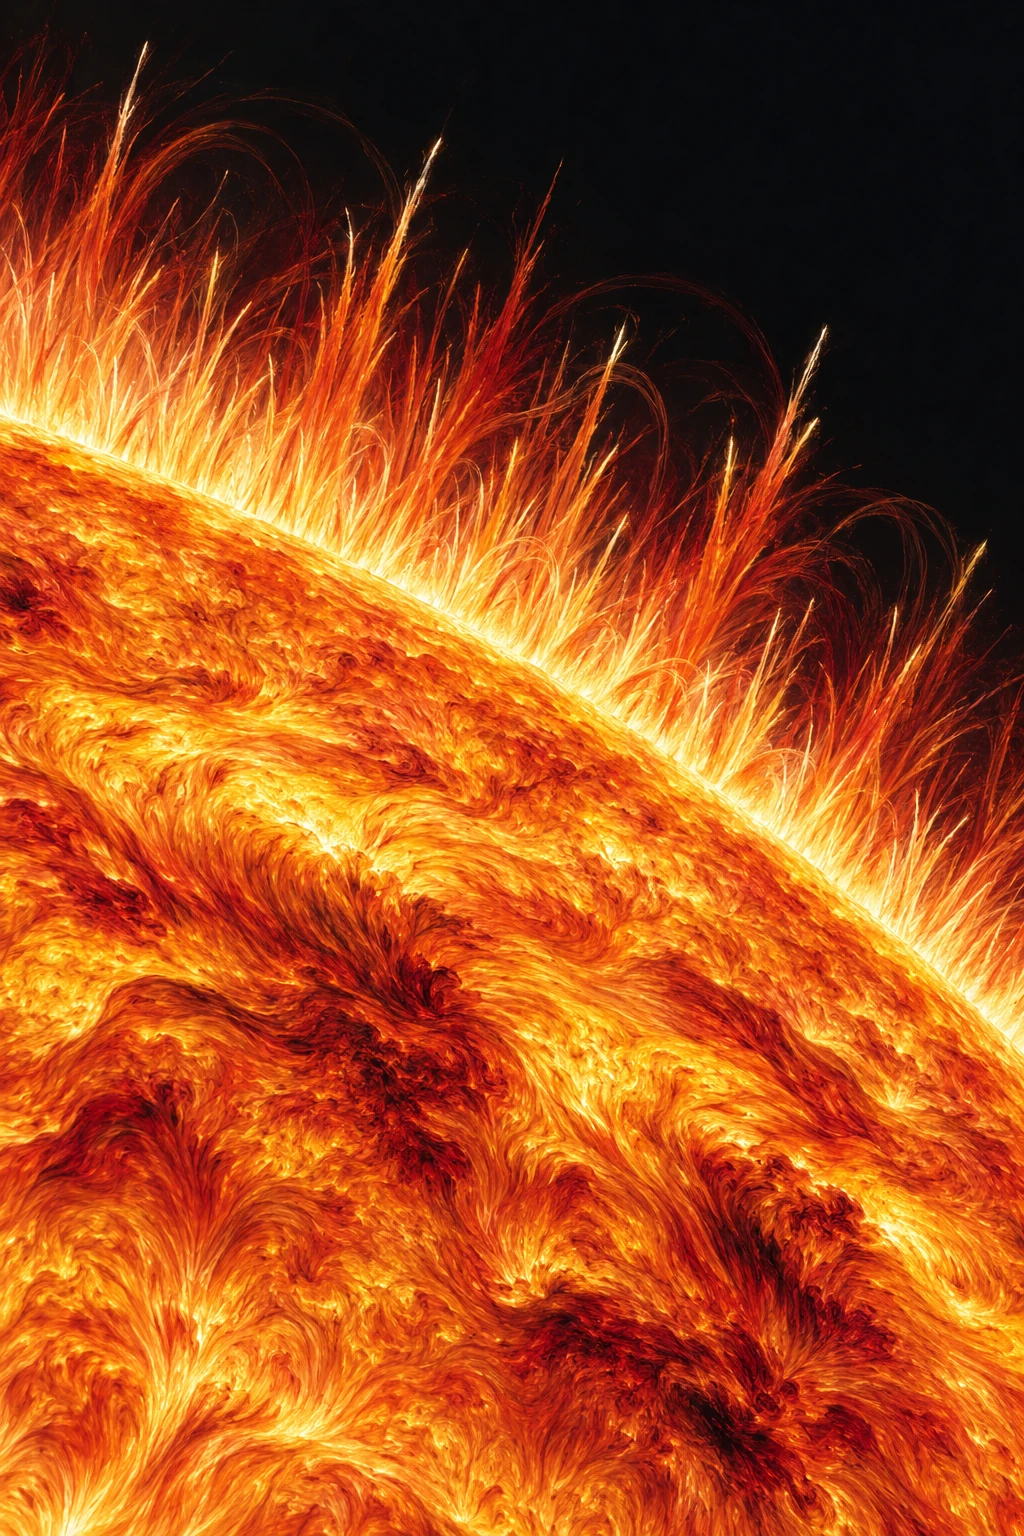
Along the Sun’s edge, a fine forest of jets rises and fades. They are small compared with a star and enormous compared with a human landscape: rapidly evolving structures in the chromosphere, the lower solar atmosphere. These jets are called spicules.
They matter because the Sun’s atmosphere poses an energy puzzle. The outer corona is much hotter than the visible surface below it. Spicules can carry mass, motion, and energy upward, but discovering a plausible contribution is different from proving that one mechanism supplies the entire heating budget.
A moving plasma structure, seen through selected light
Solar material is threaded by magnetic fields, and its appearance depends strongly on the wavelength used to observe it. A thin dark feature in one spectral line may correspond to material whose hotter component appears differently in another channel.
NASA’s IRIS mission studies the chromosphere and transition region with images and spectra. Combining spatial and spectral information helps researchers investigate motion, temperature-related emission, and energy flow in a region where many processes overlap along the line of sight.
A bright pixel is not a thermometer reading with one universal conversion. Emission depends on the atomic transition, density, ionization state, opacity, and observing geometry. That is why researchers compare several diagnostics rather than assigning a complete physical state from one dramatic image.
The Sun is not fully ionized at every relevant height
In the lower atmosphere, neutral atoms coexist with charged particles. Magnetic fields couple strongly to the charged component, while collisions and partial ionization influence how energy and momentum move through the mixture.
NASA’s 2017 report on spicule simulations describes how including neutral-particle effects helped models produce realistic jets. Magnetic tension could build and release in a whip-like process, and ion-neutral interactions contributed heating.
The result is a good example of a model improving because a missing physical ingredient was added. It is not evidence that every observed spicule shares one identical launch sequence. Different classes and environments can involve different drivers.
Waves offer another route upward
Photospheric motions include convection and oscillations. Magnetic geometry can guide disturbances into the atmosphere, where shocks and waves can drive flows or transport energy. A 2004 study combining observations and modeling investigated how oscillations leaking along inclined magnetic structures could generate spicule-like behavior.
That mechanism and later magnetic-release models need not be treated as rival headlines in a contest with one permanent winner. The solar atmosphere is heterogeneous, and the observed category can contain structures with differing lifetimes, speeds, and physical settings.
The better comparison asks which observations each mechanism explains, under which conditions, and what additional predictions distinguish them. A useful model should do more than produce something thin and upward-moving.
What a convincing heating argument needs
| Question | Why it matters |
|---|---|
| How much mass is involved? | A visible outline alone does not provide density |
| What motions and fields carry energy? | Bulk flow, waves, and magnetic energy are different terms |
| Where is energy dissipated? | Transport upward does not guarantee heating at the required height |
| How frequent and widespread are the events? | A local success must be scaled to the relevant area and time |
The table shows why an attractive jet video cannot settle the coronal-heating problem on its own. Researchers must quantify the energy delivery and its destination, then compare it with the losses that need replacing.
Observations can connect a launch and a later response
Samanta and colleagues’ study published in 2019 combined high-resolution observations of spicule formation with evidence of subsequent heating in adjacent coronal structures. Its interpretation involved interacting magnetic fields in a partially ionized lower atmosphere.
Work comparing IRIS and Solar Dynamics Observatory observations with numerical models also examined associations between spicular ejections and hotter structures. These studies improve the causal account by combining diagnostics rather than relying on a single visible feature.
Association still requires careful timing, alignment, and treatment of superposed material. An apparent disappearance in one spectral channel can mean heating out of that channel’s sensitivity rather than the physical vanishing of all the plasma.
A scale calculation without an invented Sun measurement
For a hypothetical jet that moves 5,000 kilometers in 100 seconds, the average projected speed is 50 kilometers per second. If the motion is inclined toward or away from the observer, the true speed and the line-of-sight velocity require additional information.
These are round demonstration values, not a measurement of a particular spicule. The calculation shows why video cadence and geometric projection matter. A jet observed every 30 seconds has only a few frames to define such a rise, while a faster cadence can reveal acceleration and fine structure.
Spatial resolution matters too. Several unresolved threads can look like one broad jet. Better resolution can change the apparent object population, so comparisons between instruments need a clear account of what each could distinguish.
Another useful comparison is apparent motion versus Doppler motion. Tracking a bright tip across an image measures a projected pattern speed. A shifted spectral line provides information about material moving along the line of sight under the appropriate interpretation. The two can complement each other, but they need not be the same number. A propagating heating front can also change where a feature is visible. Writing down which kind of motion was measured makes an animated jet much less likely to be overinterpreted.
Not every small solar jet is the same experiment
A thin, bright feature can be an excellent observation and an inadequate classification. Where it occurs, how it moves relative to magnetic structures, which spectral channels detect it, and what precedes it can distinguish different kinds of jet. The shared word “small” does not establish a shared mechanism.
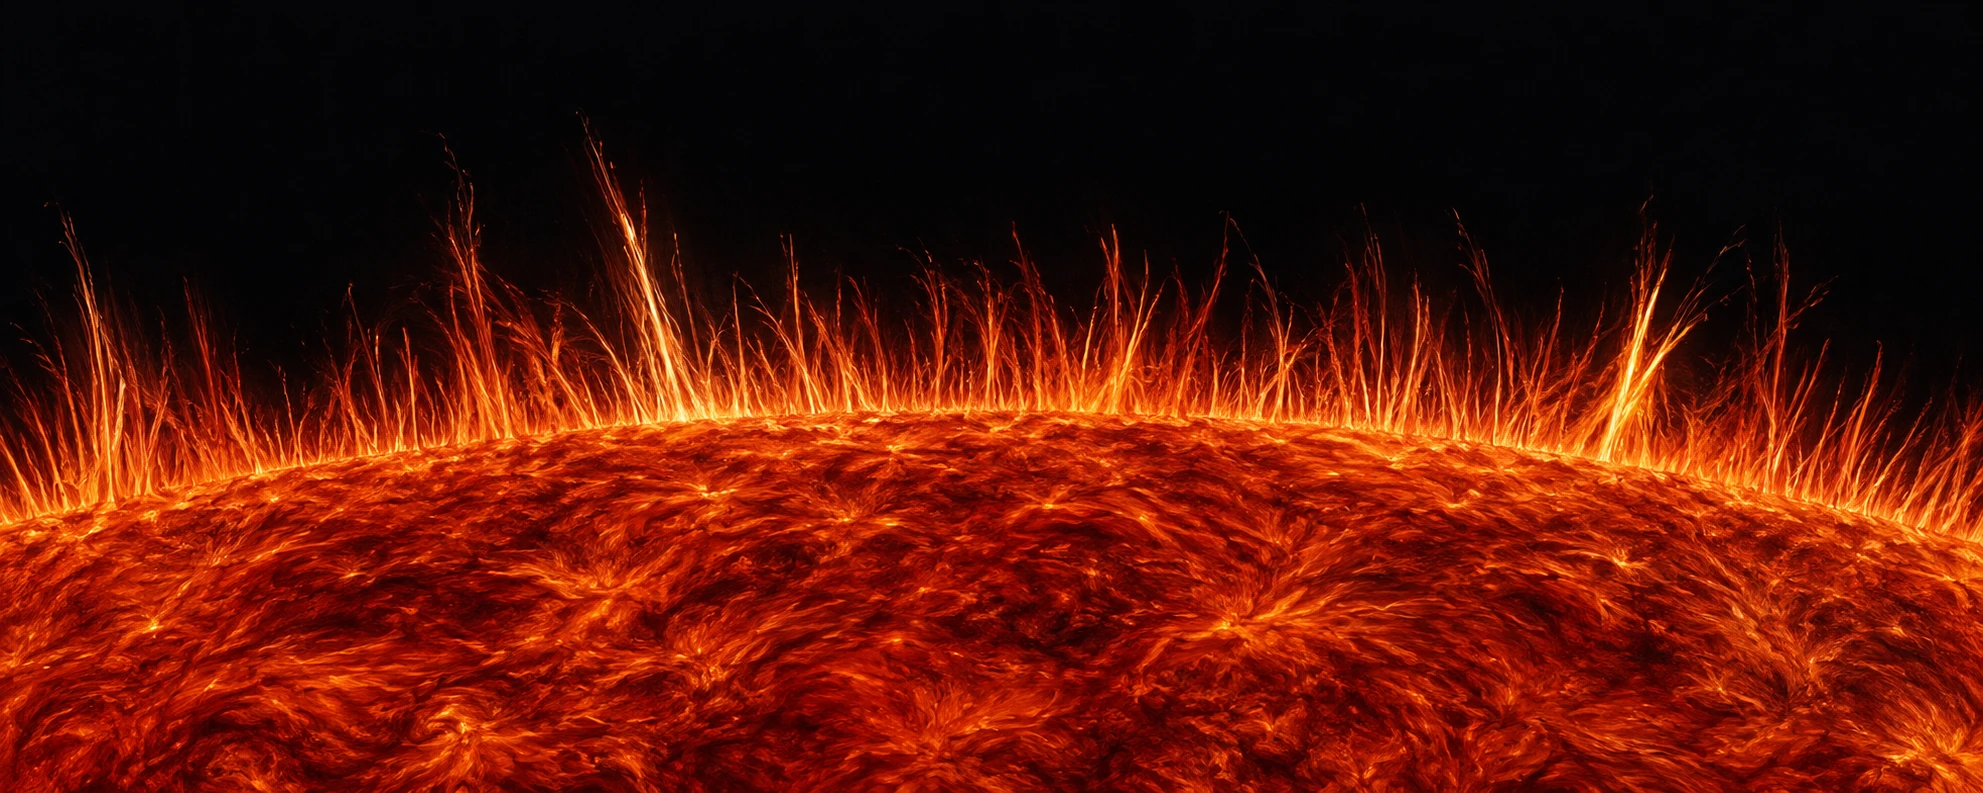
NASA’s 2020 account of nanojets describes short bright features within coronal magnetic structures, identified during a coronal-rain event. The work combined observations and simulations to investigate reconnection-related heating. Those features should not simply be relabeled spicules because both look narrow in selected images.
A different IRIS–Hinode filament study used both motions across the image and Doppler information along the line of sight to test a wave-based account. It followed a different structure and a different sequence of energy transfer. Together these cases show how several approaches to atmospheric heating can coexist without making every bright feature evidence for all of them.
A two-column viewing session
Open the NASA nanojet presentation linked in its article. Make one column for what the imagery directly displays and one for the model interpretation. In the first, record the observing region, motion, cadence when supplied, and channel. In the second, record the proposed magnetic process and where the analysis places the heating.
Do the same with the filament study’s images and model visualization. A simulation’s colored cross section is an explanation under specified physics; it is not a cross-sectional camera view through a solar thread. Keep its caption beside it when comparing the two.
Now write a criterion that could distinguish the cases. “Both are thin” is too broad. Location within a coronal loop, timing relative to rain, lateral versus upward motion, and combined spectral signatures offer more useful questions. None is a universal classification shortcut when isolated from the rest of the evidence.
The comparison also improves an energy-budget claim. Showing a physically plausible process at one place is different from showing how often it operates across the Sun and how much of the required heating it supplies. NASA’s nanojet account explicitly identifies that further counting and budgeting work.
The Sun becomes more interesting when its lively features retain their differences. A forest of spicules, a filament’s wave motions, and a short coronal nanojet can all contribute evidence while requiring distinct measurements to explain what each actually does.
Watch the limb with a researcher’s questions
Use the public imagery linked from the IRIS mission page. Identify the wavelength or channel, the cadence, and whether the colors are assigned for presentation. Track one feature through several frames rather than counting every bright tip as a separate jet.
Then write down what remains unknown: density, three-dimensional motion, temperature distribution, or magnetic geometry. Those gaps point to the next measurements. The jets become more compelling when their beauty is connected to the difficult work of accounting for a star’s energy, one short-lived structure at a time.
Sources and a next step
- NASA: IRIS mission and its measurements
- NASA 2017: partial-ionization spicule simulations
- De Pontieu et al.2004: oscillation leakage and spicules
- Samanta et al.2019: spicule generation and heating
- De Pontieu et al.: observations and models of spicule-associated heating
Continue exploring art, ideas, and unexpected connections at Incoprea.