A clear crystal need not be empty. Under a microscope, a tiny cavity may contain liquid and a small vapor bubble. The cavity is a fluid inclusion: a fragment of a fluid system enclosed within a mineral. Sometimes it was trapped while the crystal grew. Sometimes it entered a fracture that healed later.
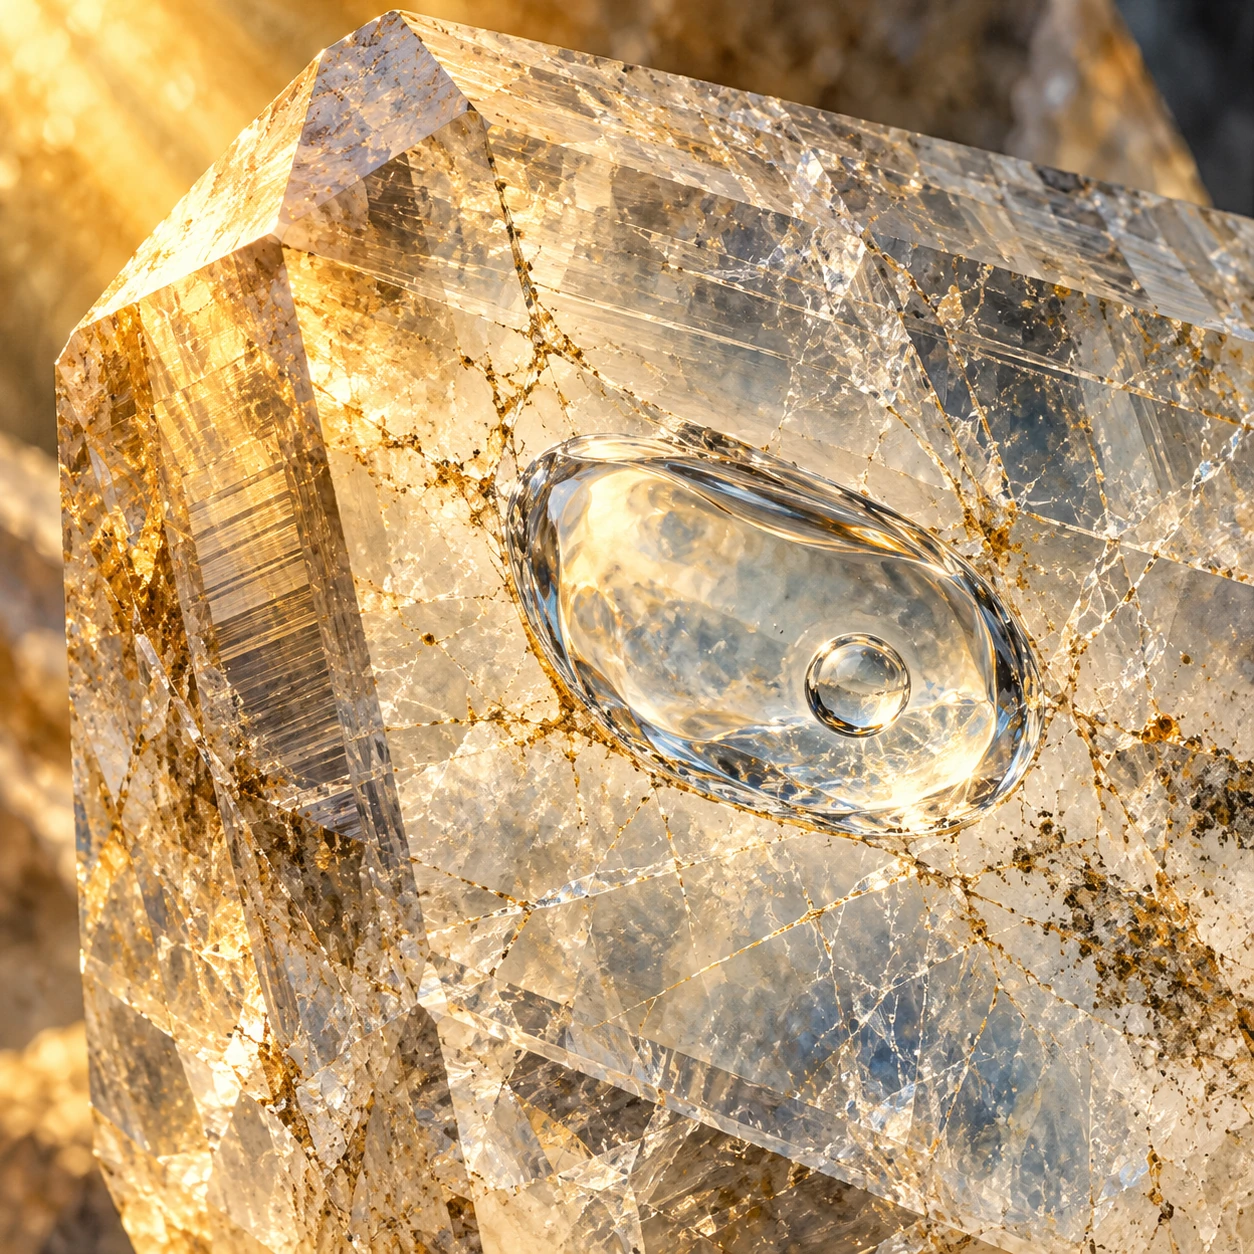
The distinction is the beginning of the investigation. A pocket inside an old crystal does not automatically contain fluid from that crystal’s original growth. Before asking what the droplet remembers, researchers establish where it sits in the mineral’s own sequence of events.
Find the population, not the prettiest bubble
Inclusions are most informative as related groups. Their positions can track growth zones, lie along healed fractures or fall into more ambiguous arrangements. Researchers examine those relationships before combining measurements, because mixing populations can blend separate episodes into an artificial average.
A study of Newfoundland amethyst used petrography and microthermometry to separate evidence from growth and later deformation. Primary inclusions and secondary inclusions helped distinguish fluids associated with different stages of the deposit. The crystal was a record with revisions, not a single sealed bottle.
The inclusions in that study were also chemically imperfect witnesses in the ordinary sense: salinity was reported as sodium-chloride equivalent. That is an operational comparison based on phase behavior, not a claim that every dissolved constituent was sodium chloride.
Watch a phase boundary disappear
Microthermometry measures changes while a carefully prepared mineral sample is heated or cooled on a microscope stage. In a suitable liquid-rich inclusion, heating can make the vapor bubble disappear. The temperature at that change is a homogenization temperature.
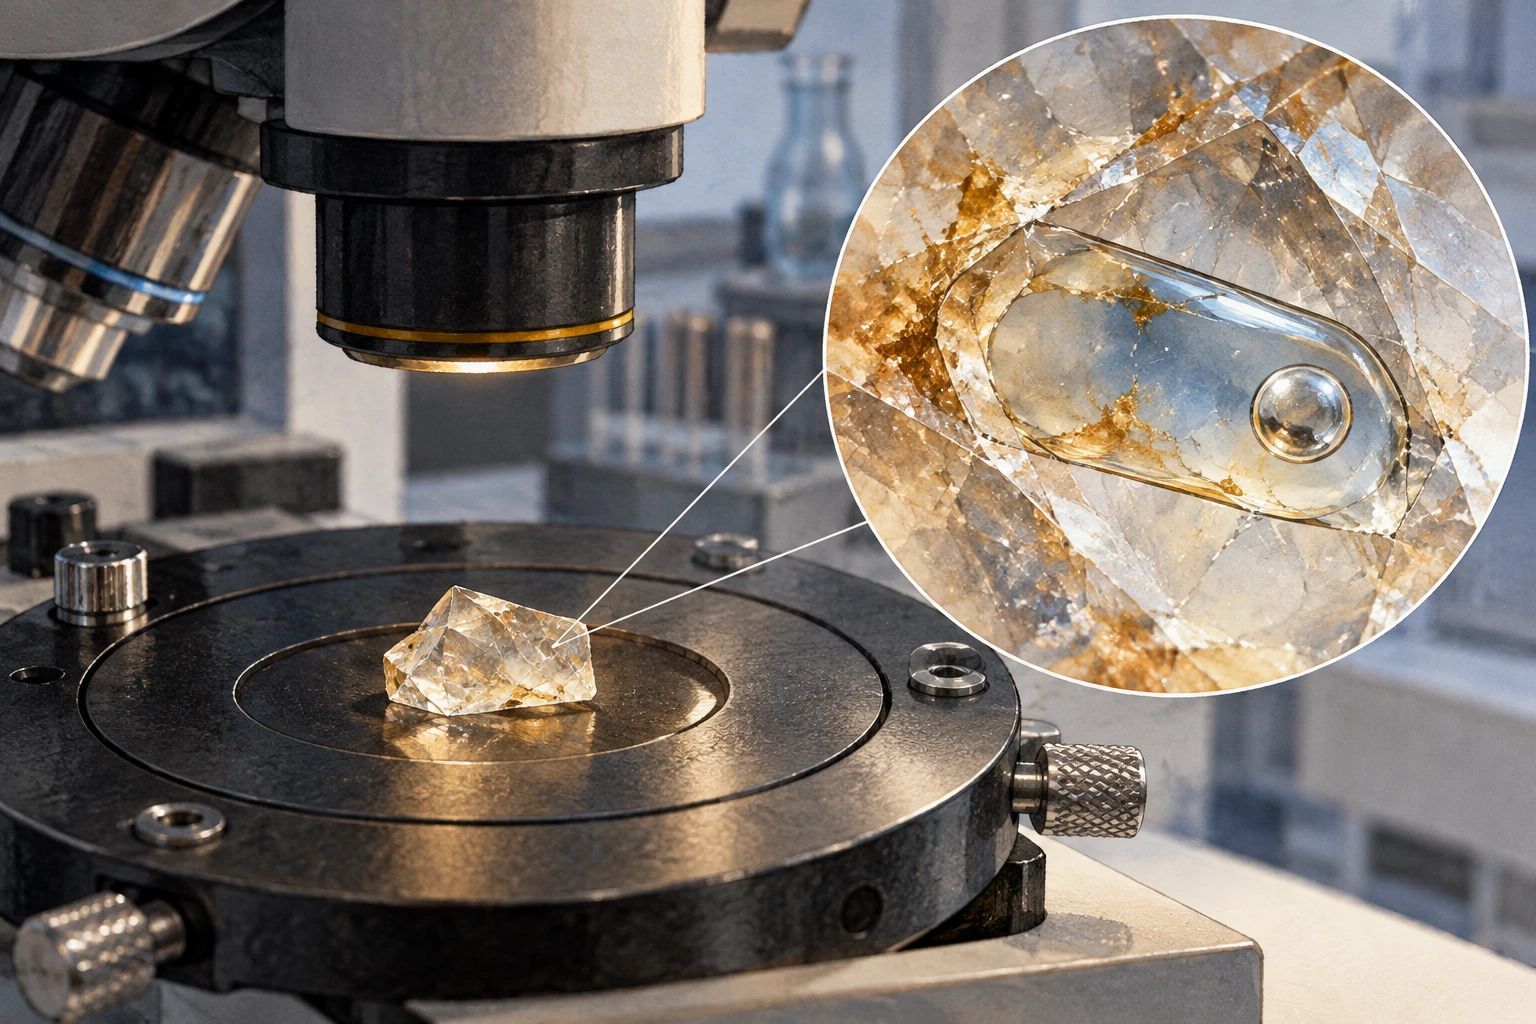
It is tempting to rename it “the temperature when the crystal formed.” That shortcut can be wrong. The pressure at trapping matters, and the inclusion must have retained a usable record. A USGS investigation of pressure corrections provides calculations for aqueous sodium-chloride systems precisely because the observed homogenization point need not equal the original trapping temperature.
The bubble itself may have developed as a once-uniform fluid cooled after entrapment. Seeing two phases today therefore does not prove that liquid and vapor were both captured together. The surrounding textures and other inclusions help test that interpretation.
A reading sequence for one imagined sample
Consider three groups of inclusions in an invented quartz section. Group A follows a crystal growth zone. Group B follows a fracture crossing that zone. Group C has irregular shapes close to a damaged margin. No temperatures are supplied, because the first task is deciding which measurements could be meaningfully grouped.
Reveal the useful order of questions
- Map the growth zones and healed fractures before assigning a fluid episode.
- Ask whether members of each group share phase proportions and textures consistent with a common history.
- Measure phase changes under calibrated conditions, keeping questionable or altered cavities separate.
- Use an appropriate fluid-composition model and independently constrained pressure before converting phase behavior into an entrapment interpretation.
Group A is a candidate growth-related population, while B is later than the zone it crosses. Group C warrants caution. Those are provisional petrographic judgments, not chemical identifications. The point is that collecting more decimal places cannot rescue a population assembled from unrelated histories.
The table behind the summary
The USGS fluid-inclusion dataset from Summitville, Colorado makes a valuable companion to a polished research conclusion. Its introduction identifies sample sources and distinguishes measurements made on different inclusion populations. The observations are tied to samples rather than offered as one universal deposit temperature.
Reading a data table this way changes the question. Instead of asking only for the highest or lowest value, look for which sample, mineral and population produced it. Repeated measurements within a coherent context can be more informative than a striking isolated number.
There are practical limits. Very small inclusions can be difficult to measure. A cavity may stretch, leak or otherwise change during its geological history or laboratory treatment. Complex dissolved constituents complicate the relationship between a phase transition and an inferred composition.
These limits explain why investigators combine microscopy with other techniques and geological context. An inclusion is powerful because it is physical material preserved in place. Its value increases when researchers test its integrity rather than treating the word “trapped” as a guarantee of perfect preservation.
The tiny bubble rewards patient attention. It is a visible boundary between phases, a clue to changing conditions, and an invitation to reconstruct the sequence around it. A crystal becomes more than a beautiful solid when its smallest internal spaces are read as part of its history.
Sources and further exploration
- Gems & Gemology: Newfoundland amethyst and fluid inclusion microthermometry
- USGS: Pressure corrections for fluid-inclusion homogenization temperatures
- USGS: Summitville fluid-inclusion data
Explore all 80 new articles · Browse the complete illustrated collection
Keep exploring at Incoprea.